AimBetter Real-Time Queries Live for SQL Server is a cost-effective solution that enables you to proactively manage multiple SQL Servers and identify bottlenecks in real time.
Real-Time Queries Live includes real-time capabilities to monitor database activities – queries – and identify bottlenecks, enabling a proactive approach guaranteeing stable systems. It is an affordable tool that adds valuable insights into what impacts SQL Server-based systems in a user-friendly interface that can manage multiple instances in a single place.
With AimBetter’s flexible licensing model, it is also easy to upgrade this package to the RTPS: Real-Time Problems Solving solution at any time.
Starting at $110*/ Database Server
*Monthly, for annual licenses with 1 day history
including OS layer and SQL Server single instance
Prevent Disruptions with Real-Time Control
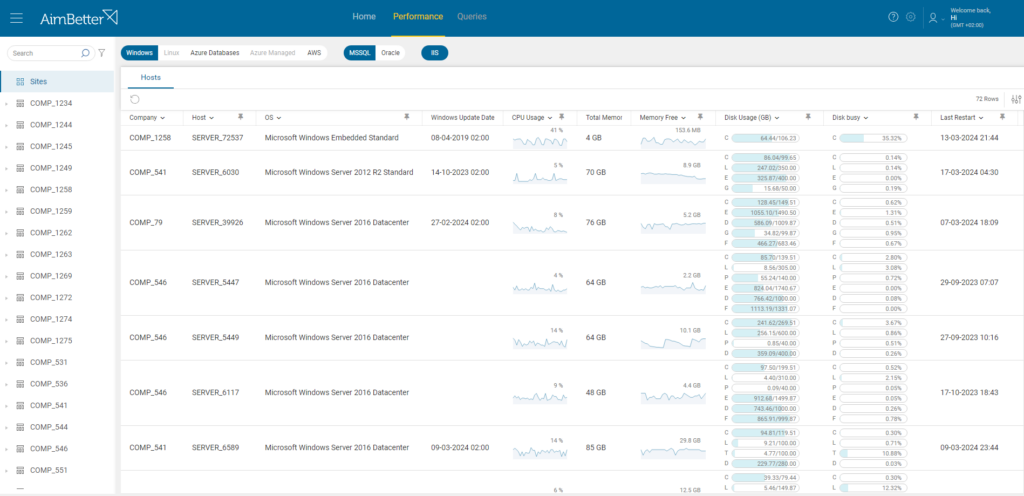
Multiple Database Servers Metrics
Selected metrics about each Database Server: OS version, Last Windows Update, CPU Usage, Total Memory, Free Memory, Disk Usage, Disk Busy, Last Restart.
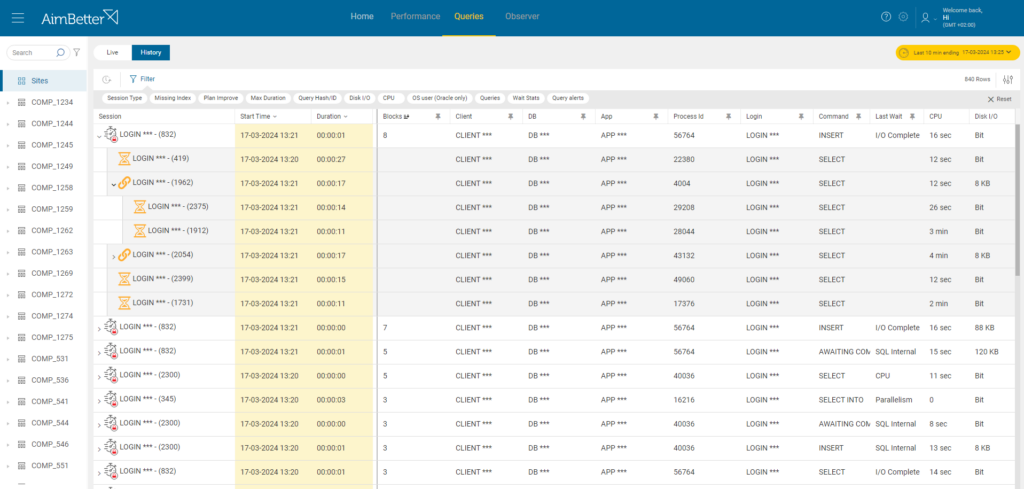
Insight into Database Activities
Understand bottlenecks and what is blocking users or running for too long.
Multiple filters are available: Blocking, queries with Open Transaction, Max Duration, CPU time, Disk I/O, and more.
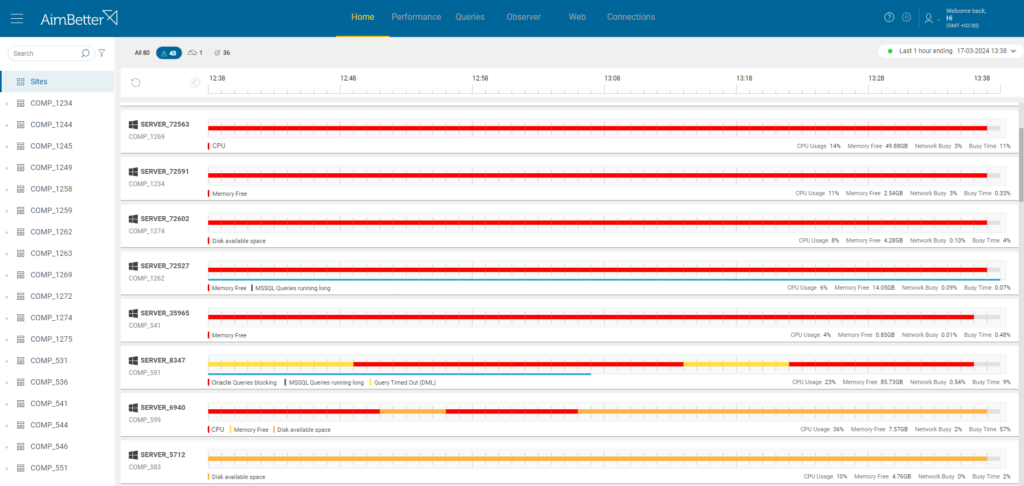
Issues Tracking
A friendly dashboard allows you to see all the notifications for the last hour in one place, in addition to the e-mail. You can also go back to some previous hour.
AimBetter stands out for:
Real-Time Diagnosis
✓ Sys-DB-App-Client Cross-information analysis
✓ Pinpoints the root cause in real-time
✓ Proactive smart notifications
✓ Shortens the Troubleshooting time
✓ ML continuous improvement
✓ Automatically detects code, security, data loss issues, and much more
Powerful DBA Capabilities
✓ Millions of queries/minute
✓ Execution plan analysis and download
✓ Plan improvement recommendations
✓ Missing index suggestions
✓ Top resource-consuming queries
✓ Followup on DB growth and Backups for optimal maintenance
Seamless Integration
✓ 5-minute Installation
✓ Friendly & Intuitive for all the IT Team
✓ Ready to Use Solution
✓ 100% SaaS, no System Overhead
✓ Hundreds of Built-in Metrics
✓ Scalable, great for Enterprise and SMBs
Features Comparison
AimBetter RTLV: Real-Time Live Queries vs. RTPS: Real-Time Problems Solving
AimBetter Features Comparison |
RTQL |
RTPS |
Home + Email Notification
|
✔ |
✔ |
Basic Performance Metrics Alerts – CPU Usage, Free Memory, Disk Usage |
✔ |
✔ |
Advanced Performance Metrics Alerts – more than 100 Performance Metrics |
✔ |
|
Queries Alerts – Blocking/ Long-running/ Open-transaction |
✔ |
✔ |
Basic DB & Backup Maintenance Alerts – Full Backup, Log Backup, Diff Backup, Log Oversize, Data Growth, Log Growth |
✔ |
✔ |
Advanced DB & Backup Maintenance Alerts |
✔ |
|
Failure Events Alerts – Observer Module Events |
✔ |
|
Basic DB Status Alerts – DB Status (suspect/recovering/etc.), Drop/Create/Restore DB |
✔ |
✔ |
Advanced Status Alerts |
✔ |
|
Service Not Running Alert |
✔ |
✔ |
Suspicious Process Alert |
✔ |
|
Change Tracking Alert – Installations, Upgrades, Resources addition/subtraction, Service status changes, DB creation/deletion, OS Configuration changes, and more |
✔ |
|
Performance Module – System |
✔ |
✔ |
Host Tab – Basic Metrics – OS Version, Windows Update Date, Last Restart, Total Memory, Disk UsageIncluding graphs for the retention period of: CPU Usage, Free Memory |
✔ |
✔ |
Host Tab – Additional Metrics |
✔ |
|
Network Tab |
✔ |
|
Disk Tab |
✔ |
|
CPU Tab |
✔ |
|
Paging Tab |
✔ |
|
Services Tab |
✔ |
|
Process Tab |
✔ |
|
Images Tab |
✔ |
|
Analyze Tab |
✔ |
|
Performance Module – Database |
✔ |
|
MSSQL Tab |
✔ |
|
Oracle Tab |
||
DB Tab |
✔ |
|
Wait Stats Tab |
– |
✔ |
Queries Module Live / History |
✔ |
✔ |
Text Search Filters |
✔ |
✔ |
Condition Filters: Blocking, Open-Transaction, Long-Running, Max Duration, Disk I/O, CPU, and more |
✔ |
✔ |
Extend column on the default |
– |
✔ |
Get Plan |
– |
✔ |
Plan Improvement Recommendation |
✔ |
|
Missing Index Recommendation |
✔ |
|
Client-side Process |
– |
✔ |
Client-side CPU |
– |
✔ |
Queries QAnalyze |
– |
✔ |
Top CPU-consuming queries |
✔ |
|
Queries Execution Count |
✔ |
|
Queries Average/ Total Duration |
✔ |
|
Queries Average/ Total Cache Usage |
✔ |
|
Queries Disk Usage/ IO |
✔ |
|
Queries Total Rows |
✔ |
|
Plan Improvement Recommendation |
✔ |
|
Missing Index Recommendation |
✔ |
|
Get Plan |
– |
✔ |
Observer Module |
✔ |
|
Deadlocks |
– |
✔ |
OS Activity – Windows Events, ERP Events, Applications Events, etc. |
✔ |
|
SQL Activity – Permission Violation, Login Events, Data loss Events, Code Errors, etc. |
✔ |
|
SQL Backup Details – Time, Path, Size, Device, Status, etc. |
✔ |
|
Change Tracking Logs: Software updates, DB Creation/Deletion, Service Status changes, Resource capacity changes, etc. |
✔ |
|
SQL Code Exception |
– |
✔ |
Web Module |
✔ |


