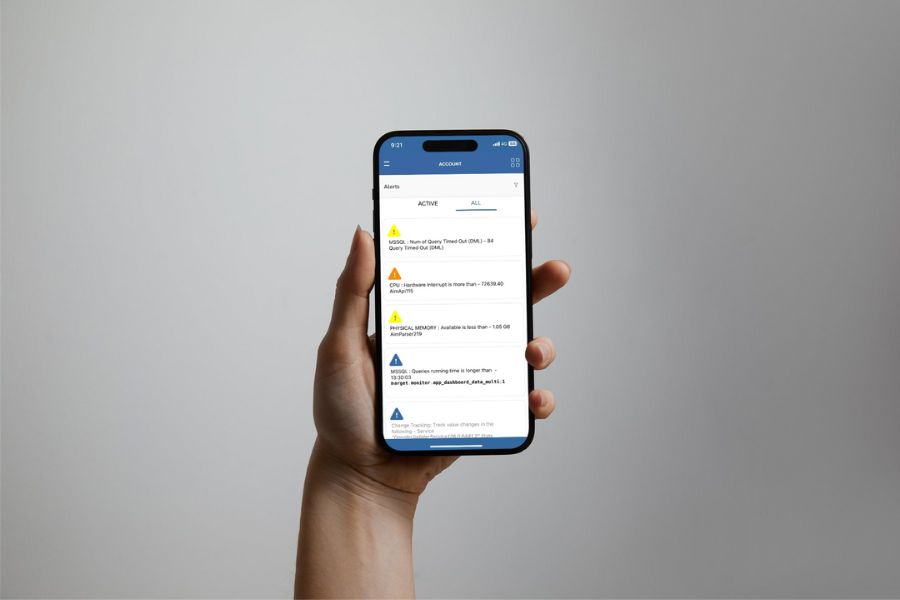
By monitoring and analyzing more than 400 metrics across every layer of your database system environment every minute, AimBetter provides a complete and immediate view that empowers you to proactively identify the root causes of performance issues, such as slowness or outages, and anticipate potential problems before they impact users or harm your business.
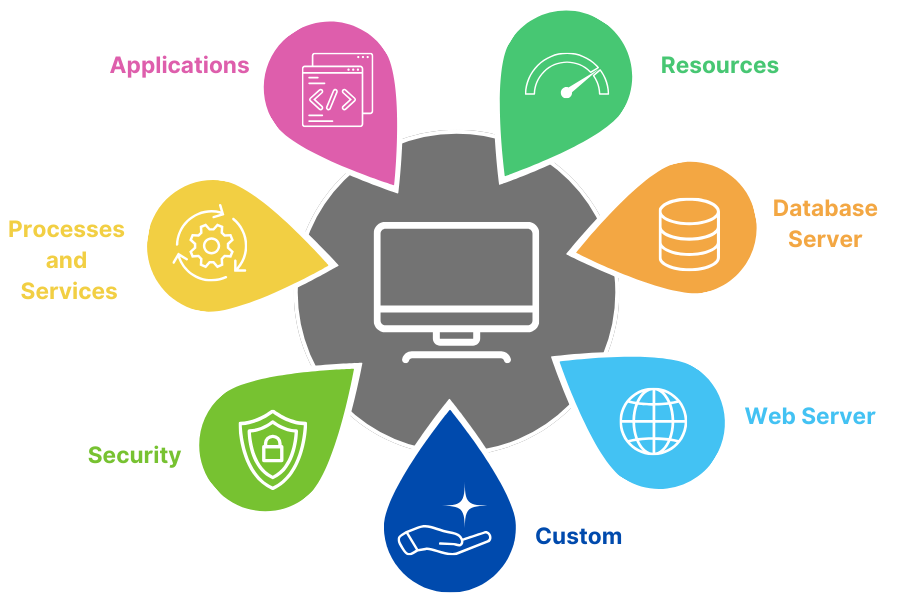
These metrics can be categorized into several types, each focusing on a specific aspect of system and database performance. Below, we break down the key metric types and provide examples of each to illustrate their importance.
The complete list of metrics can be found in this link.
1. Resource Metrics
These metrics measure the utilization and availability of essential hardware and system resources, providing insights into potential bottlenecks or failures.
Examples:
- CPU Utilization: Tracks the percentage of CPU usage to identify overloading or underutilization.
- Alert: High CPU usage (>85%) sustained over a specific period.
- Memory Usage: Monitors the amount of RAM used versus available memory.
- Alert: Low memory availability (<10%) detected.
- Disk Space: Keeps track of disk capacity and usage trends.
- Alert: Free disk space below 5% triggers a warning.
Click here for the complete list of metrics.
2. Database Server Metrics
Metrics specific to database servers are crucial for monitoring query performance, transaction integrity, and connection efficiency.
Examples:
- Long-Running Queries: Identifies queries that exceed expected execution time.
- Alert: Query running longer than 30 seconds.
- Deadlocks: Detects conflicts where two or more processes are waiting for each other to release resources.
- Alert: Deadlock occurrence triggers an immediate notification.
- Blocked Sessions: Tracks sessions blocked by other operations.
- Alert: Session blocking detected for over 10 seconds.
Click here for the complete list of metrics.
3. Web Server Metrics
For systems involving web applications, AimBetter monitors metrics that affect the performance and stability of web servers.
Examples:
- Response Time: Measures how quickly the server processes requests.
- Alert: Response time exceeds 3 seconds for a specific endpoint.
- HTTP Error Rates: Tracks the frequency of 4xx or 5xx error responses.
- Alert: Error rate exceeds 5% of total requests.
Click here for the complete list of metrics.
4.Security Metrics
Security metrics focus on detecting and mitigating potential threats to your systems, ensuring data integrity and protecting against unauthorized access.
Examples:
- Unauthorized Access Attempts: Tracks failed login attempts to identify potential brute-force attacks.
- Alert: More than 5 failed login attempts within 5 minutes for a single user.
- Suspicious Activity Logs: Identifies unusual activity patterns, such as high-frequency queries or unexpected IP addresses.
- Alert: Multiple database queries from an unrecognized IP address within a short period.
- Configuration Changes: Monitors changes to critical system configurations, such as firewall or database settings.
- Alert: Unauthorized configuration change detected.
- Malware Detection: Tracks potential signs of malware, such as unusual process behavior.
- Alert: Process flagged as suspicious by antivirus tools.
Click here for the complete list of metrics.
5. Process and Service Metrics
These metrics focus on individual processes and services running on servers to ensure that critical functions remain operational.
Examples:
- Service Status: Monitors whether essential services (e.g., SQL Server, IIS) are running.
- Alert: A critical service stops unexpectedly.
- Process Resource Usage: Tracks CPU or memory consumption by specific processes.
- Alert: A process consumes over 50% of CPU for more than 1 minute.
Click here for the complete list of metrics.
6. Application Metrics
Metrics that directly measure application performance to optimize end-user experiences.
Examples:
- Application Errors: Tracks unhandled exceptions or crashes in applications.
- Alert: Application error rate exceeds 1%.
- Transaction Failures: Identifies failed operations in critical workflows.
- Alert: Failure rate exceeds the defined threshold.
Click here for more information about exceptions.
7. Custom Metrics
AimBetter allows users to define and monitor custom metrics specific to their unique operational needs.
Examples:
- Business-Specific KPIs: Monitor metrics like order processing time or inventory synchronization delays.
- Alert: Order processing time exceeds 2 minutes.
Click here for more information about customized alerts through the Connection feature.
AimBetter’s robust alerting system ensures you are promptly informed about potential issues, enabling swift corrective action and maintaining system performance at peak levels. It empowers businesses to stay proactive, reduce downtime, and optimize resource utilization, delivering measurable ROI and operational peace of mind.
The complete list of metrics can be found in this link.


