1. Queries are not optimal. Priority: High
Poorly designed SQL queries to increase the need for large sort or hash operations, as a result, the PGA memory cache hit ratio is lowering, indicating bad performance.
Queries not properly optimized with inefficient query execution plans can lead to poor performance as well. This can include missing or outdated statistics, inappropriate use of joins or subqueries, unnecessary sorting or grouping, or inefficient use of functions.
Execution plans provide valuable insights into how the queries are being processed and help to identify areas where inefficiencies exist.
Problem identification:
Identify which queries are running long and whether resource usage has increased, specifically look for disk I/O. Check the indexing and query execution plan.
- Track the database server activity: Identify which statements have a high execution time and consume the most resources. For Oracle, you can use the built-in AWR together with SQL Trace, which can include data from top SQL statements, execution plans, wait events, and resource consumption. This mission requires a skilled DBA.
- Identify whether the query is a stored procedure or a job that is running for a specific schedule, or a single user that is running it from a specific application.
- Check the PGA allocated memory by the next commands: IPGA_AGGREGATE_TARGET (when using manual management)/ PGA_AGGREGATE_LIMIT (when using auto-management).
- Investigate the query code and execution plan, looking for missing indexes or excess subqueries. To get this data, you can use Oracle tools like EXPLAIN PLAN for execution plan data or SQL Access Advisor and DBA_ADVISOR for missing index recommendations. Examine index usage and fragmentation: Evaluate the usage and fragmentation of indexes in the database. Unused or fragmented indexes can impact query performance.
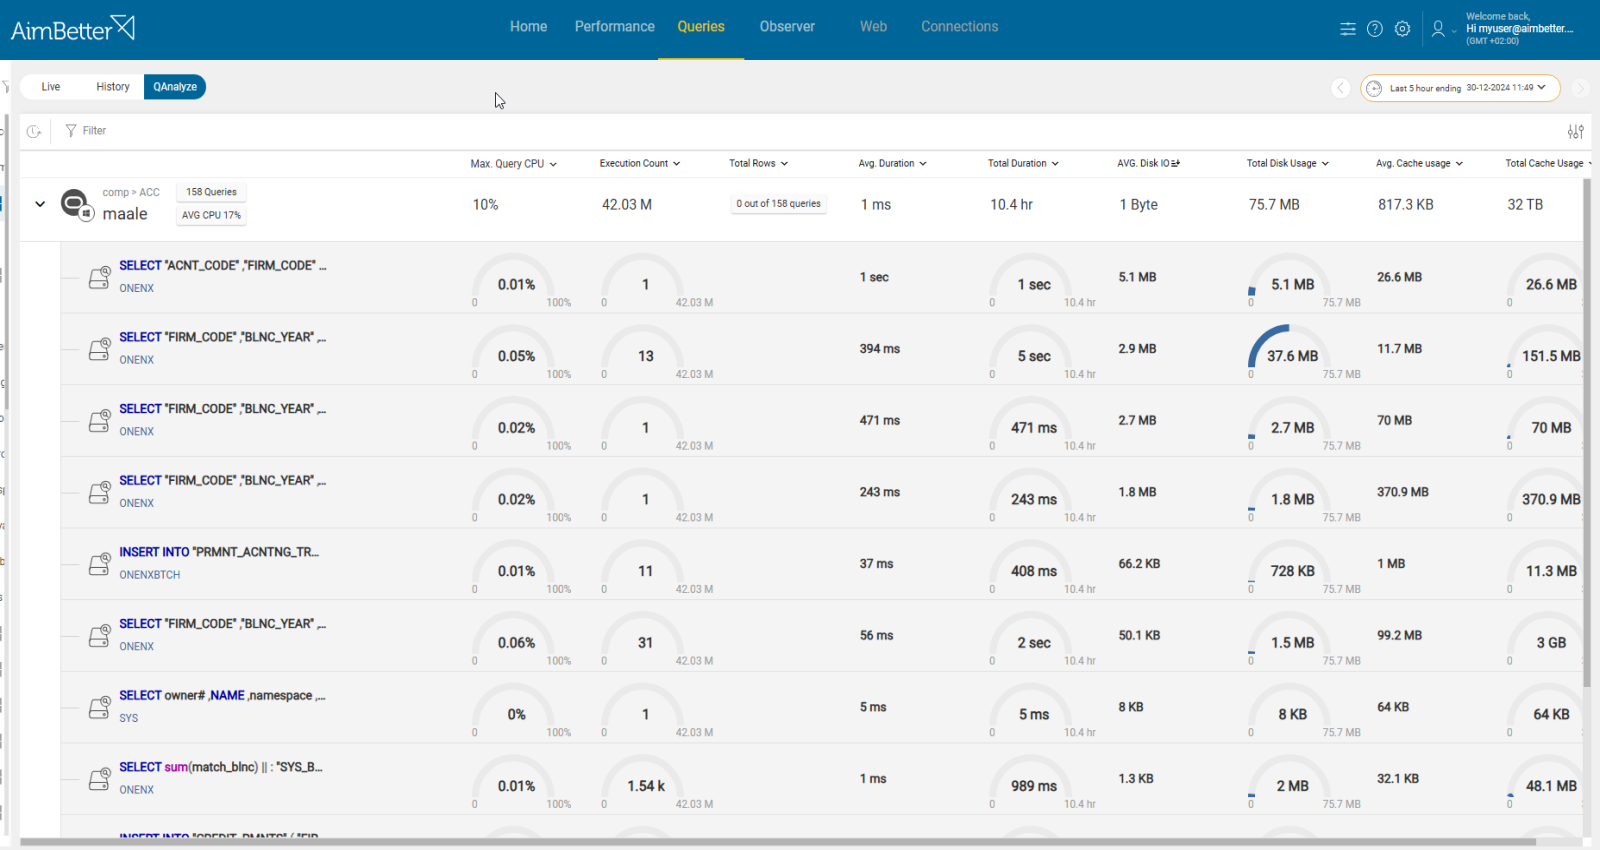
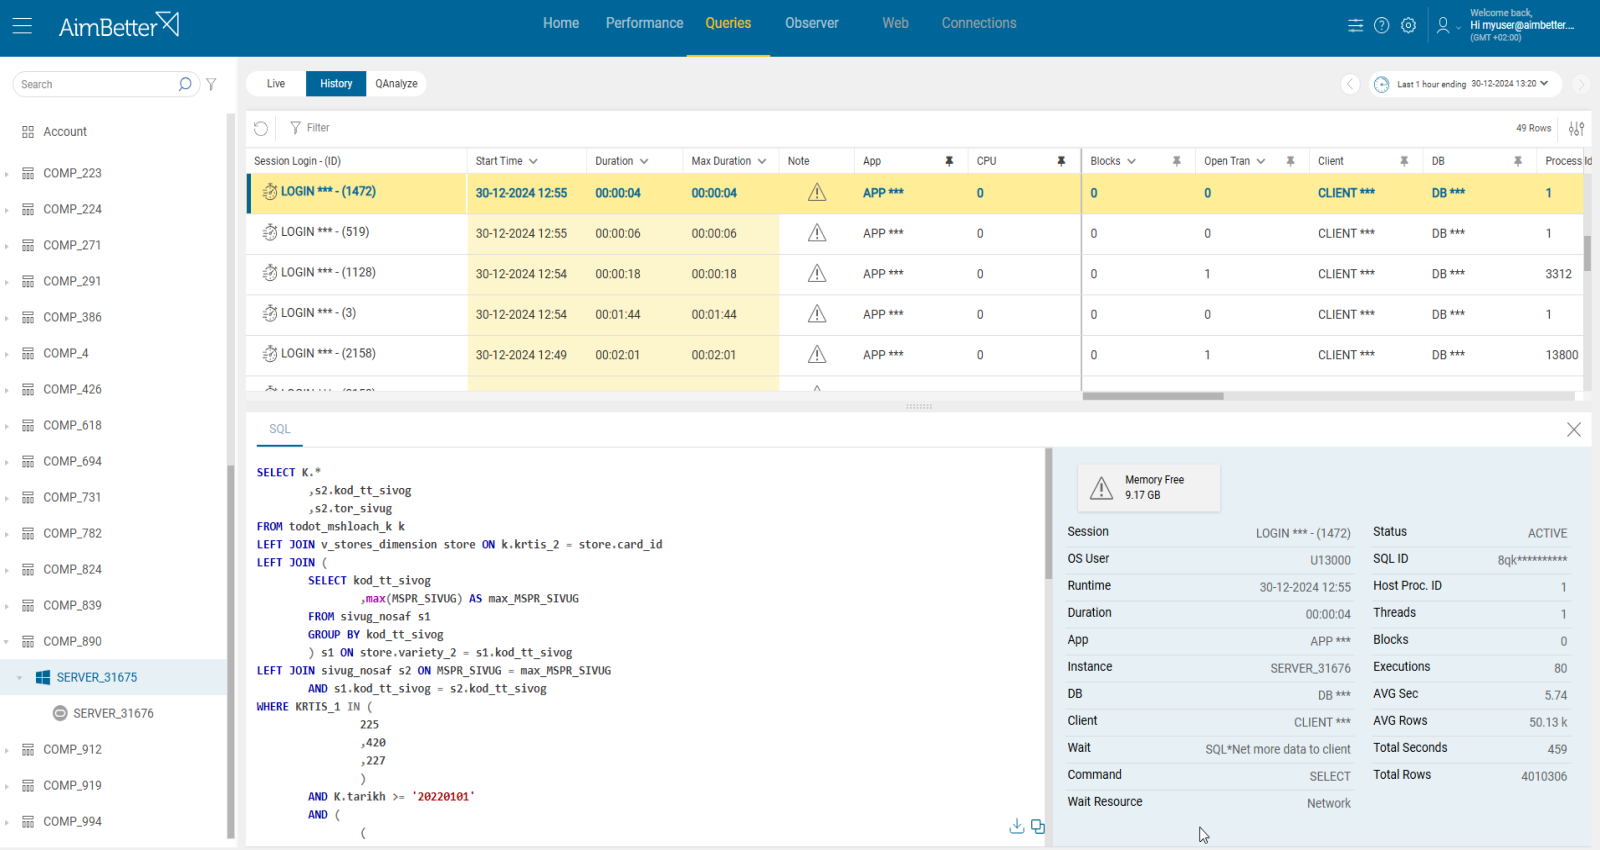
- All running queries can be viewed from a single screen.
- You can filter and sort the queries by execution time or resource utilization or even search for a specific query text.
- The query execution plan and missing indexes are available immediately, even when the queries run live, including notes showing improvement recommendations.
Recommended action:
Check the bottlenecks of the long-running queries and optimize accordingly. Before making these changes, consult with a DBA who understands the data model.
Investigate the query’s execution plan and look for heavy tasks and loads of data.
Make sure you are using proper indexes, add or delete indexes if possible and needed
Break complex queries into more simple steps, and make sure to use proper filtering, WHERE clauses, and JOIN operations. Avoid using extensive sorts, large hash joins, or aggregations which consume significant memory.
2. Large number of sessions. Priority: Medium
A large number of sessions competing for PGA memory can exhaust available resources.
Check the active session count in an Oracle database using the same PGA memory pool. If the number of sessions exceeds the database’s ability to allocate sufficient PGA memory for each session, memory contention occurs. As a result, database operations are forced to use disk I/O, which leads to a low PGA cache hit ratio and degraded performance.
Problem identification:
Check the active session count and if it has increased recently in parallel to the lower PGA.
- Identify the number of active sessions by using V$SESSION count. For that, you are required to log into the database server and have permission to query it. In parallel, use V$PGASTAT to observe PGA memory usage.
- Check the application’s logs for any unusual activity or errors related to connections. You have to know where it’s located and how to search for it in the logs. You can also try using V$SQL_WORKAREA_HISTOGRAM to analyze work areas that exceed PGA memory.
- Check if some queries are the same process running in several different connections.
- You should track this issue to characterize the routine behavior of connections in your environment.
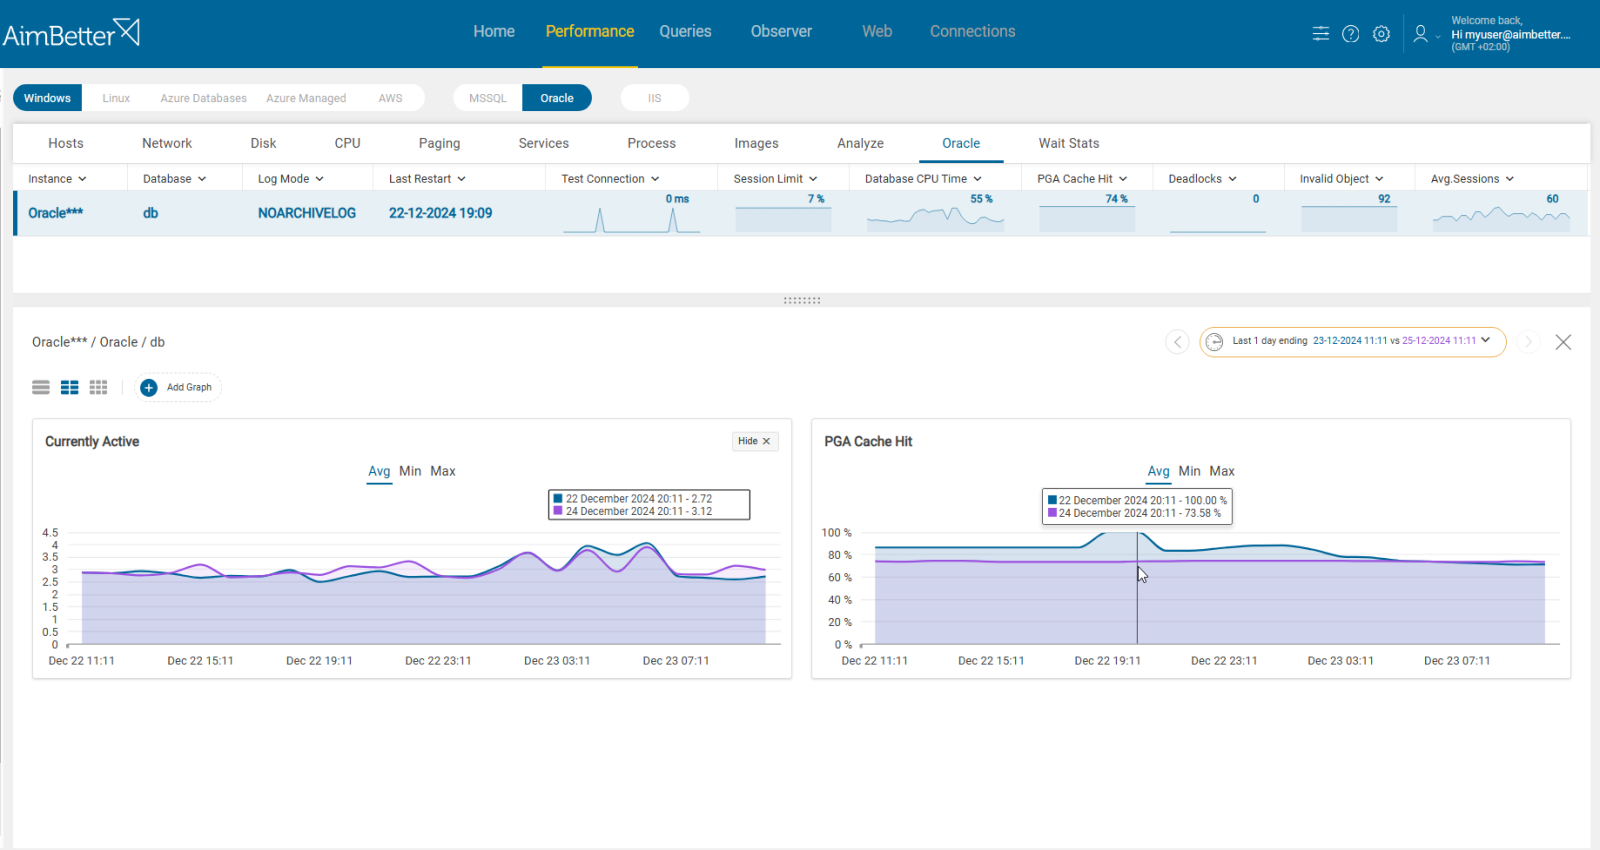
With AimBetter, you can easily find both PGA usage and active session count, updating automatically 24/7.
Looking for patterns in a well-structured panel makes the investigation process simple.
Recommended action:
If the session count seems as regular activity, you should optimize PGA Allocation. Otherwise, reduce the session count by limiting the number of active sessions.
Investigate the sessions, identify unnecessary sessions, or tune inefficient queries.
3. Memory management isn’t configured well. Priority:Low
Misconfigured memory management occurs when inappropriate settings for memory allocation( manual or automatic), result in low PGA memory. This causes slowness in SQL operations like sorts or hash joins, leading to frequent disk I/O.
This happens when PGA settings do not fit the workload’s requirements.
Problem identification:
Workflow seems regular, yet the PGA buffer cache ratio is low.
- Use V$PGASTAT to observe PGA memory usage. Check for its limit as well.
- Check disk I/O status. In Windows, tools like Performance Monitor (Perfmon), such as disk read/write speeds, are used. In Linux, use commands like ‘iostat’, ‘vmstat’, or ‘iotop’ to check disk read/write operations, and I/O wait times in real-time. Take in account that you are limited to current time without any history.
- Look for Oracle logs and review them to see if there is anything about lowered PGA that involves high disk I/O.
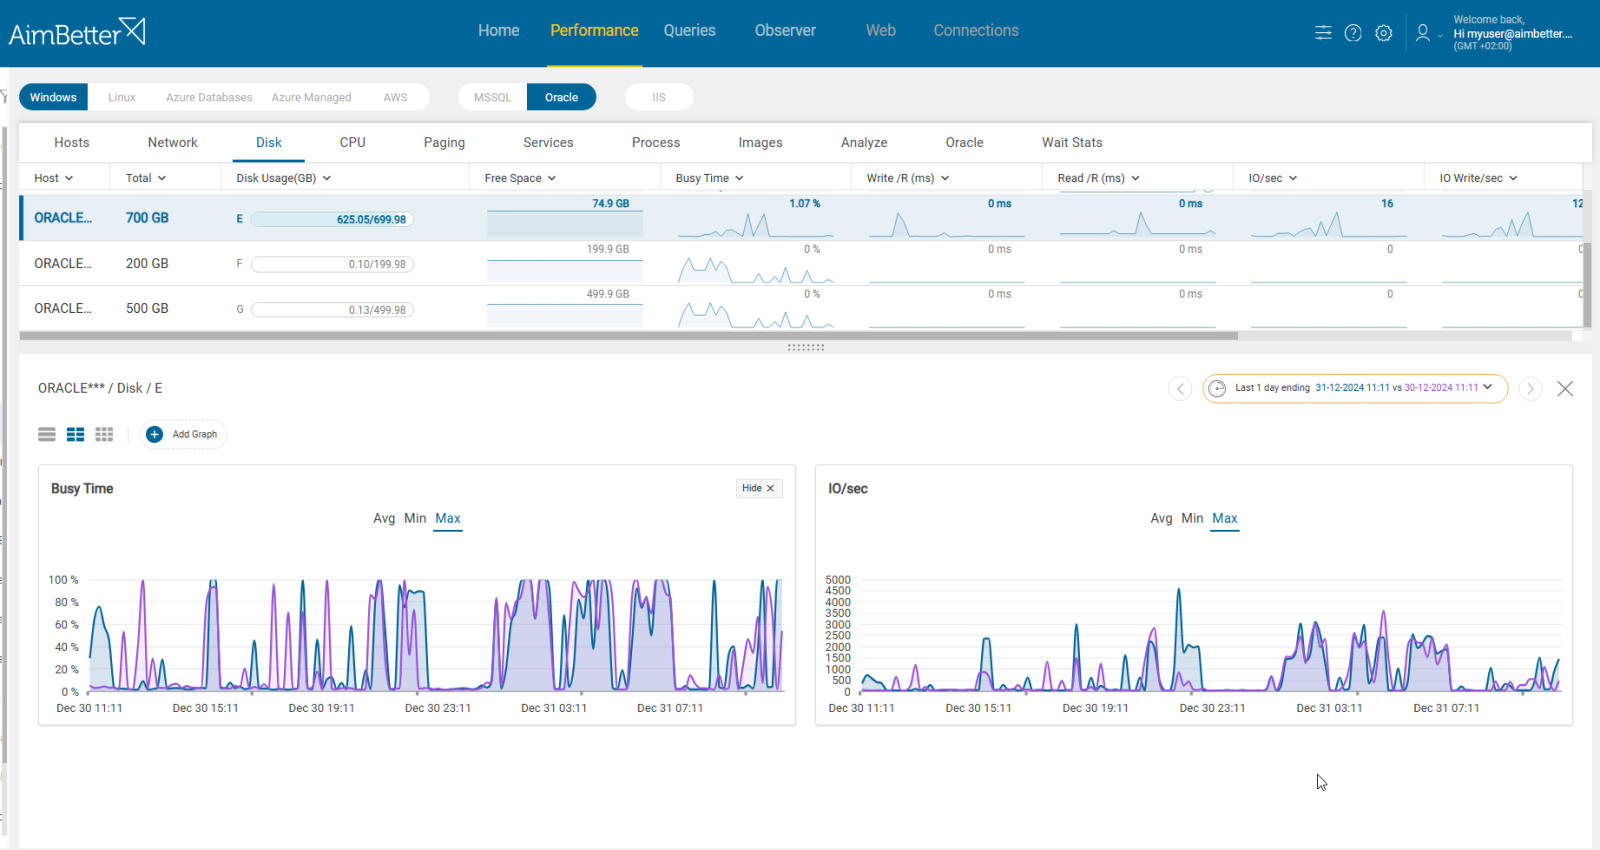
There is no need to work hard in the investigation when all data is available easily via one control panel, which has the ability to compare different periods.
Recommended action:
Ensure appropriate memory management settings while checking the typical workload demands. Avoid over-allocating PGA at the expense of SGA, ensuring a balanced distribution of memory resources.
4. Database configuration unfits
Once the Oracle version is too old or the configuration settings don’t fit the workload, the operational capabilities utilizing memory are inefficient, which leads to insufficient PGA allocation.
This can result from running older Oracle versions or failing to update initialization parameters to match current workload demands.
Problem identification:
After checking several possible causes for low PGA cache hit ratio, check if poorly tuned database settings are the leading cause.
- Observe PGA memory usage and query ‘V$PARAMETER’ to check for outdated or suboptimal settings. For this and the next steps, you have to login the Oracle database server and use the required permissions to query it.
- Use a query to verify the Oracle version; use ‘V$VERSION.’ Ensure it’s a recent, supported version.
There is no need to work hard and worry about querying the database once all data is available via the AimBetter Interface.
Recommended action:
Upgrade to the latest stable Oracle version for performance enhancements and modern features. Adjust memory-related parameters to align with current workloads.
Regularly analyze database workload and adjust memory settings accordingly.


