Disk space, also known as storage space, refers to the amount of digital storage capacity available on a physical or virtual disk or drive, such as a hard disk drive (HDD), solid-state drive (SSD), or USB flash drive. Disk space is used to store various types of data, including operating systems, applications, documents, photos, videos, and other files. File extensions might be different as well.
This metric measures the disk available space in units of GBs. The more disk space available, the more data can be stored on the disk or drive.
We recommend free space to be at least 20% of the disk’s total capacity. If you run out of disk space for your database files, you become extremely limited in what you can do on this server.
While there are many reasons for file growth, some of which are normal and expected, several conditions can lead to abnormal conditions and need attention before seriously inhibiting regular activity.
These include:
– Backup failure – see our detailed explanation of the cause and effect of this here. Use the console to look at the application log for details of the backup activity.
– In case of SQL unexpected data growth, use the AimBetter SQL trace facility to pinpoint the reason for this.
– Transaction and tempDb logs can grow quickly. See our detailed explanation of the cause and effect of this here.
Find out how you can save hours of work when investigating the root cause of this issue.
Symptoms:
The free space ratio on the designated disk has fallen below the threshold.
Impact: High
Maintaining sufficient storage space is a critical factor in the proactive prevention of sudden problems. Examples of severe impact are where data files cannot grow when full. Result – users can’t add new data. In cases when the backup procedure is failing, transaction logs may be filling up the drive. As a result, the system cannot modify any data.
Expected behavior :
There is no standard metric for free space. AimBetter performance monitor displays free space on all system disks and provides statistics on total storage space on each drive, free space, read/write response times, and total busy time. Based on our experience, more than 15GB or 10% of free space is recommended in all the disks.
Possible causes:
1- Operating system conflict Priority: Medium
Large files and applications can take up a significant amount of disk space. These files might be program files, application logs, single-user files, database activities, and more. These files might be even temporary system or application files (.tmp or dump ) that accumulate over time. If an excessive amount of data is saved to the disk, it might cause low disk space.
Problem identification:
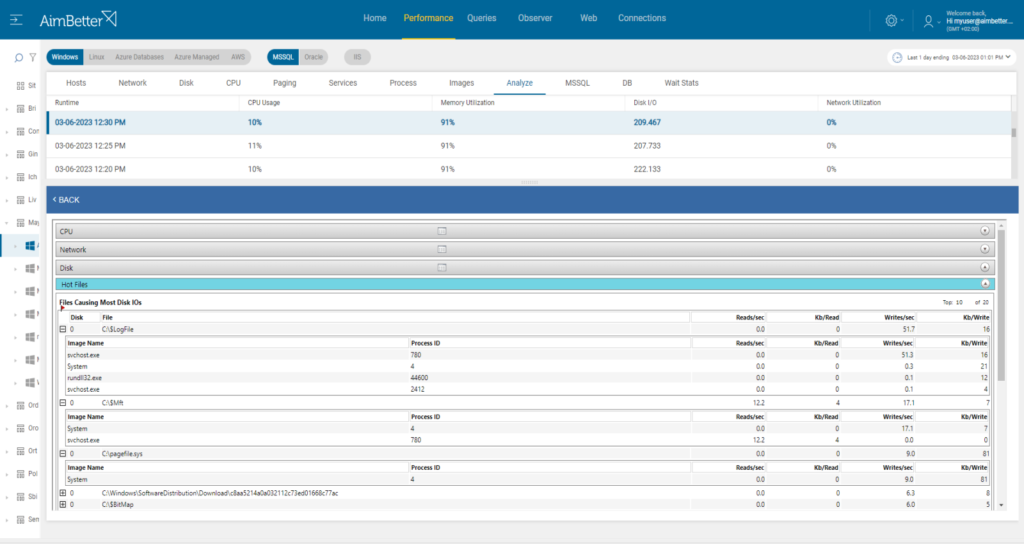
Identify large files or large-sized folders with many files that are saved on the disk, these might be new or existing files.
- Go to File Explorer and review the drive’s free space status. For Linux, run “fdisk-l” to list all disk devices. You can also use the “smartctl” command, which provides the Self-Monitoring, Analysis, and Reporting Technology tools suite, which can provide detailed information about disks.
- Use a performance monitor or any other system tool to identify large files. Remember that you are limited to their current status.
- To locate the cause of the problem, run a full scan of the disk’s content. For that, you need a specific desktop application, such as Treesize. On one of the scans, consider focusing on .tmp or dump application files.
- When finding the cause, try to figure out why this exact file has increased and how to prevent it from happening again. Without proper event history, this might be time-consuming.
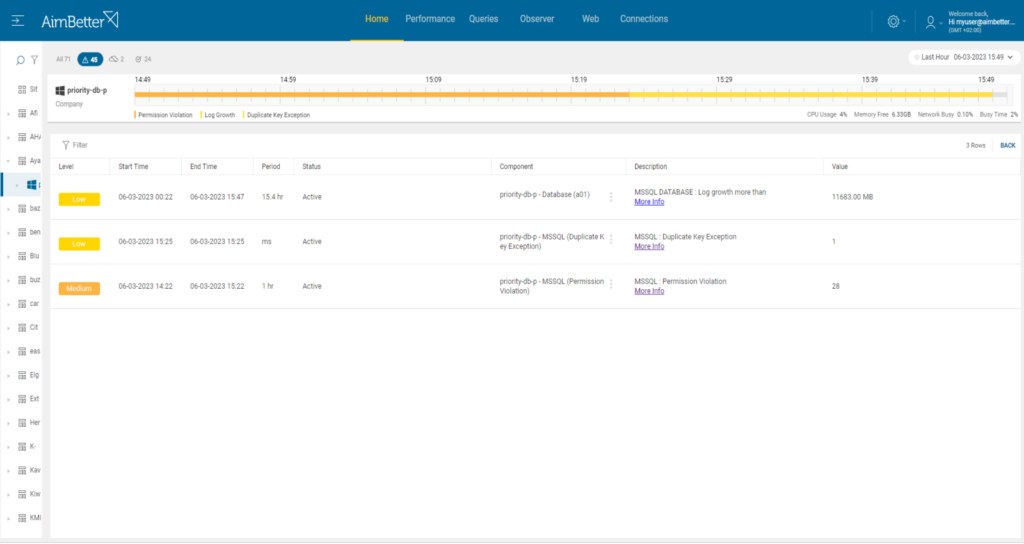
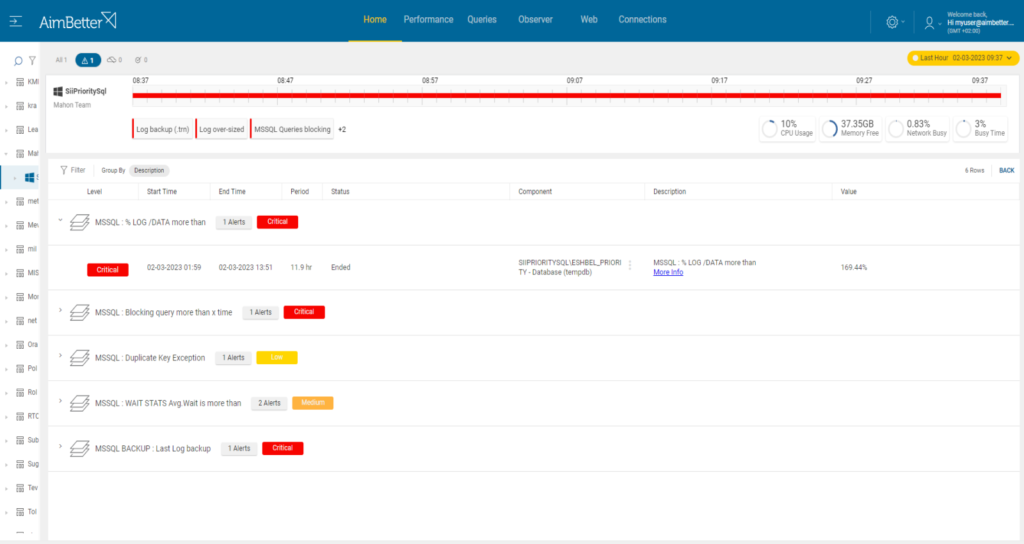
You’ll be immediately notified if there is a low disk available space!
Our solution provides easy access to finding the root cause immediately when knowing about low disk space issues, providing a history of system changes on all OS resources.
Recommended action :
Examine the disk free-space reporting. If necessary, working with operating system reports, identify whether there is sufficient space in unnecessary files, for example, old or redundant copies of data. Delete these files and run a disk clean-up. If there is still not enough, further disk capacity must be added.
2- Backup failure Priority: Medium
Overall database and log size are highly dependent on the performance of regular backups. Backup should execute as quickly as possible to avoid clashes where one backup has failed to complete, and another is scheduled to start. A sudden backup failure might happen because of low disk space.
Problem identification:
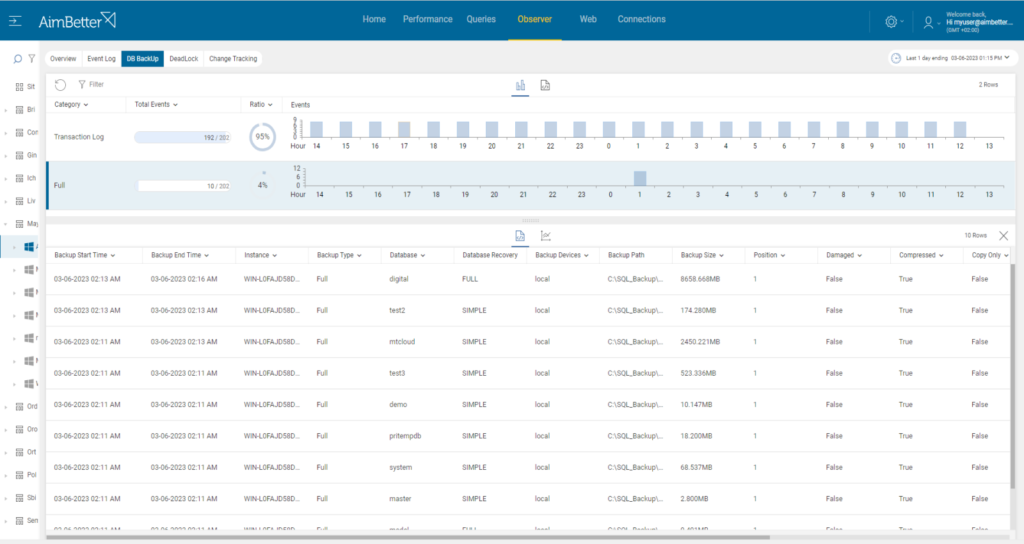
Investigate the main cause of the backup failure, and check the OS resources and current status of database files.
- Look for error messages in the event viewer, SQL server agent logs, or other tools. Error messages can be also generated by the backup software or the operating system. Searching for the right cause might be challenging and take time.
- Track the backup process. Look for incomplete backups or timeouts. It could be a sign of connectivity issues caused by low disk space.
- Check older backup files and compare whether the backup files grew for the last attempts. These checks might take time and require knowledge of the current backup and data components.
You’ll be immediately notified if there is a low disk available space.
Simply check the accessible backups’ root path and error logs in order to learn about this issue.
Recommended action :
If possible, Consider reducing the frequency or number of backups, or backing up to an external drive. Otherwise, consider upgrading the current disk size or deleting old backup files.
For more information, see our entry regarding backups here.
3- Data or log growth Priority: Medium
SQL imposes no absolute limits on file growth beyond physical disk size. In cases when there are high levels of user activity, it might cause transaction log growth or data growth.
Problem identification:
Check current data (.mdf or .dbf), and log (.ldf or .log) files size and try to identify the reason for the growth.
The data file contains the actual data of the database, such as tables, indexes, and other objects.
The log file contains information about changes made to the database, such as transactions and database modifications.
- Locate the data and transaction log files and review the current sizes of the files. You can do it using file explorer (when knowing the correct paths), checking manually using the SQL Server management studio (SQL Server ) or SQL Developer (Oracle), or writing and executing a script checking it. This might require time, provided with the help of an expert that knows the backups settings.
- Find out the cause for the sudden increase in data or transaction log files. You would probably have to wait for it to recur again and then start tracking it by tracking tools (for example- SQL Server Profiler) or using a monitoring tool.
- Once finding the problematic queries, figure out how you should improve them, using the query execution plan. This task might take a long time, requiring a DBA that knows the organization’s needs. There is a chance that this improvement is unnecessary, sometimes the issue might be only a user’s mistake, for example creating a big test database in the wrong environment, causing unnecessary usage of driver’s space.
You will be immediately notified once there is a sudden data or log file growth.
Using our solution, it’s easy to track the problematic queries, where data and performance history are saved for at least 30 days.
Recommended action :
Use past performance together with current behavior to maintain enough free space to handle all possible cases. In most cases, anomalies requiring action should be identified quickly, in order to avoid harming smooth business flow. For that, our experts are able to help.
Refer here for guidance on causes of issues caused by log growth or here for data growth.
4- Large volume of data written to tempdb or pritempdb database or Oracle tablespace Priority : Medium
For SQL Server, Tempdb is a system database in Microsoft SQL Server that is used to store temporary user objects such as temporary tables, table variables, and stored procedure output.
Pritempdb is the temporary data storage of Priority, which functions as working with temporary tables based on real data tables. Each table is inserted with new rows and when finishing the execution, then the rows should be cleaned up. These tables tend to overgrow when it’s not operating well, thus it consumes high disk space.
For Oracle, there is table space. A tablespace is a logical storage unit, a collection of data files, that is used to organize and manage physical storage structures within a database. Tablespaces are used to manage the physical storage of data in an Oracle database, and they provide a way to allocate and manage storage resources for the database objects. There might be a chance that this definition does not fit the current disk available space.
Queries that run with a large number of iterations, or are in a state of block or deadlock, will write large volumes to logs until they can commit
Problem identification:
Track the usage of the data and log files of these databases. Search for increased usage rate, large transactions, or poor performance related to execution plans.
- Monitor the database size before and after causing low disk space. When not using proper tools for that, it would be hard to track.
- Check the database growth rate settings and the live growth rate. This can be done by creating a script running in a loop, using tracking tools or correct monitoring tools.
- Once identifying the growth, try to find the queries that have caused it. If you don’t have a history of data, you have to wait for it to happen again, and use profiling tools such as SQL Server Profiler for SQL Server, or Oracle Trace for Oracle.
- Find a way to improve the problematic queries by examining the execution plan, and looking for exceptions or problematic coding.
Our solution provides an easy track of the issue and its cause. Once there is a sudden growth, you immediately receive an alert about it, and you can easily find the problematic query and have access to the execution plan.
Recommended action :
Investigate the queries and improve performance by examining the execution plan or finding code errors. If needed, increase available free space by deleting unnecessary files, or moving other files to a different drive.


