This alert indicates that the hard disk is overwhelmed and unable to process input/output operations as quickly as required by the applications. It measures the disk response time (in seconds), signaling a potential bottleneck in the system. High disk activity can originate from both the operating system and database workloads, requiring an investigation into queries that heavily utilize physical I/O or CPU resources.
Disk I/O overload can lead to a deceptively high CPU load. When a task is waiting for disk I/O, the CPU stops processing it and enters a “waiting” state, often seen as 100% busy but idle due to power-saving mechanisms. While the CPU waits, query queues grow longer, CPU-dependent processes slow down, and overall server performance degrades significantly.
SQL Server or Oracle determines when and how disk I/O is required. The Windows operating system performs the actual I/O operations via its subsystem, which includes components like the system bus, disk controllers, and storage devices (e.g., hard drives, tape drives). This architecture makes the I/O subsystem a frequent cause of system bottlenecks, especially under high workload scenarios.
Expected behavior
No standard metric exists, but this value should be regarded with user activity and experience or total OS overload. Our recommendation is for disks to respond within the set threshold.
Possible causes
1- Operating system conflict Priority: Medium
Besides database functions, the server performs functions relating to other operating system activities, such as anti-virus scans, disk clean-up, OS updates, etc. If an unusually high level of these coincides with high database activities, there may be an excessive load on the disk from competing elements.
Problem identification:
Check the operating system activities and look for abnormal behavior.
1. Look for the anti-virus scan schedule. Antivirus software can sometimes conflict with the operating system or database activities and cause high disk IO. In order to identify which database activities are colliding with anti-virus scans, you will probably have to use tracking tools such as SQL Server Profiler for SQL Server or AWS for Oracle. This task requires dba and might take time. It will also be inaccurate enough since checking from the current moment with no option to compare with former similar events.
2. Look for incompatible drives. Sometimes, the driver is not compatible with the operating system’s current activity. There is a chance for higher system activity that collides with the disks’ possible usage. Most operating systems do not have the correct tools that can check it.
3. Use task manager or other system tools, and look for tasks consuming high disk I/O. This check won’t be precise since it focuses only on the exact moment, with no history of events.
4. Look for fragmented files. It might cause high disk I/O.
With our solution it’s easy to identify the root cause of the issue.
Each query has a note regarding an anti-virus scan while it’s running.
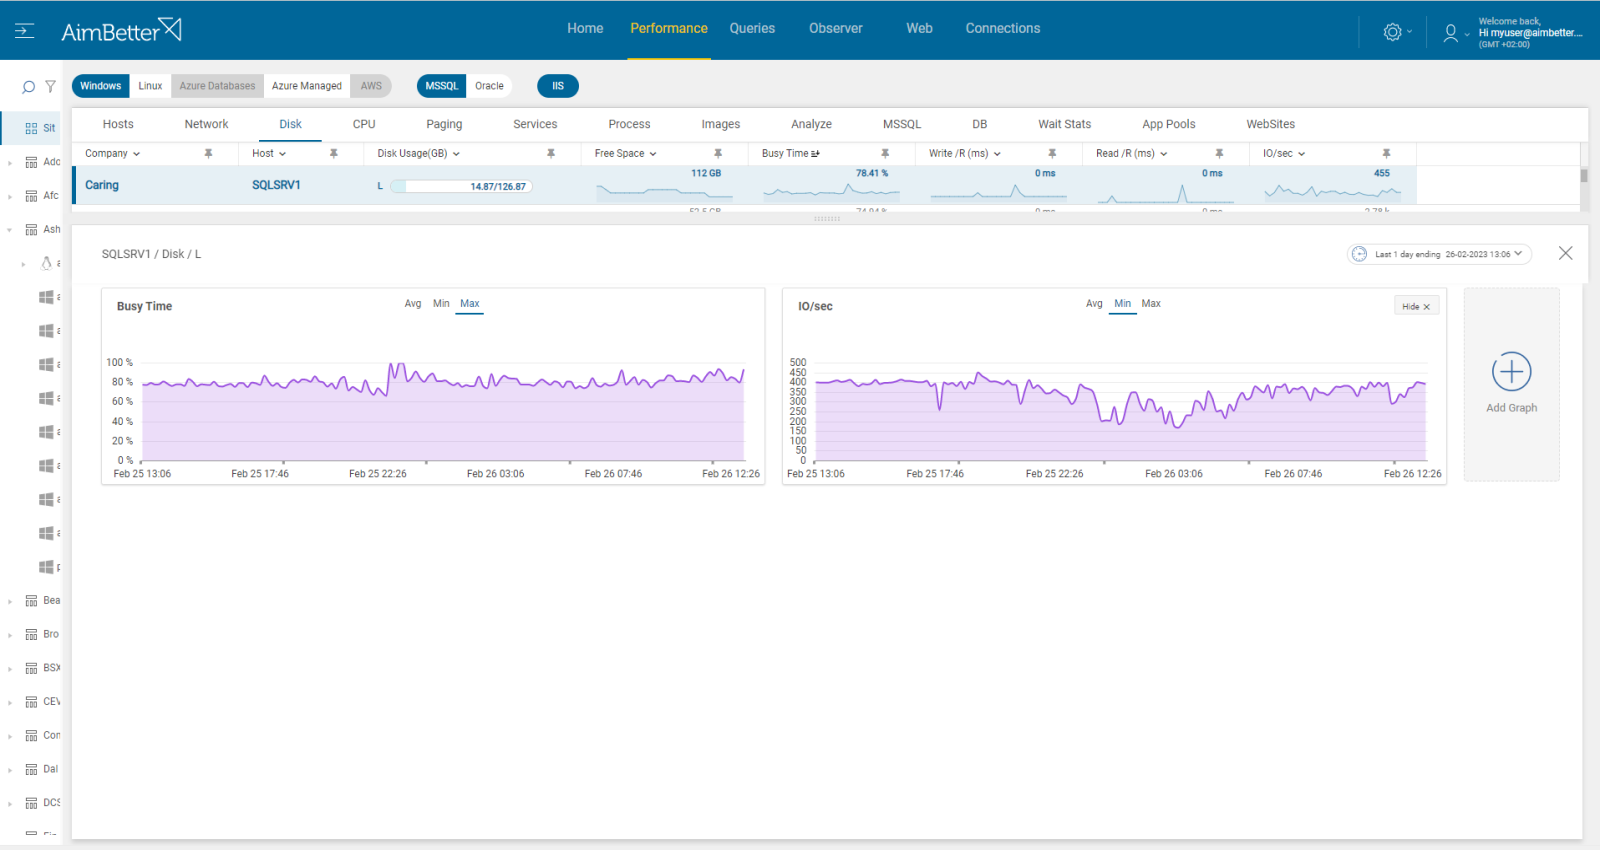
Viewing the current performance of the disk is easy to check with our tool.
With our system updating logs, tracking tasks that have now and before highly consuming disk I/O is easy.
Our system will notify if files are fragmented when specifically monitoring file connections.
Recommended action:
Avoid running an anti-virus scan during working hours. However, if it’s necessary, exclude database files from the scan. Replace the drive with one that can provide higher performance and I/O utilization. You will probably need downtime for this process.
Improve query performance: redesign the program to maximize the use of indexed data. Redesign table structures to match the requirements of the programs by building indexes. Make use of temporary tables.
2- Faulty storage hardware Priority: Medium
A storage issue like a bad controller battery or general issue at the Virtual Machine. In addition, possible issues are fragmented files, meaning they are spread out in different parts of the hard drive. Furthermore, disk errors can occur due to the disk’s physical damage. These issues might be related to reading or writing slow responses or a system crash.
Problem identification:
Check the disk I/O performance in order to determine which is the general hardware fault currently.
1. Look for slow write/read speeds. If it occurs, it might cause high disk utilization. This can be tested by running disk benchmarks or monitoring disk activity. However, these checks are not accurate since they relate to the current moment with no history.
2. Look for disk errors. It might be hard to find.
3. Follow up on whether the server or the virtual machine freezes or crashes. If so, then after this event there is a possibility for disk I/O. However, it might be tiring to follow it.
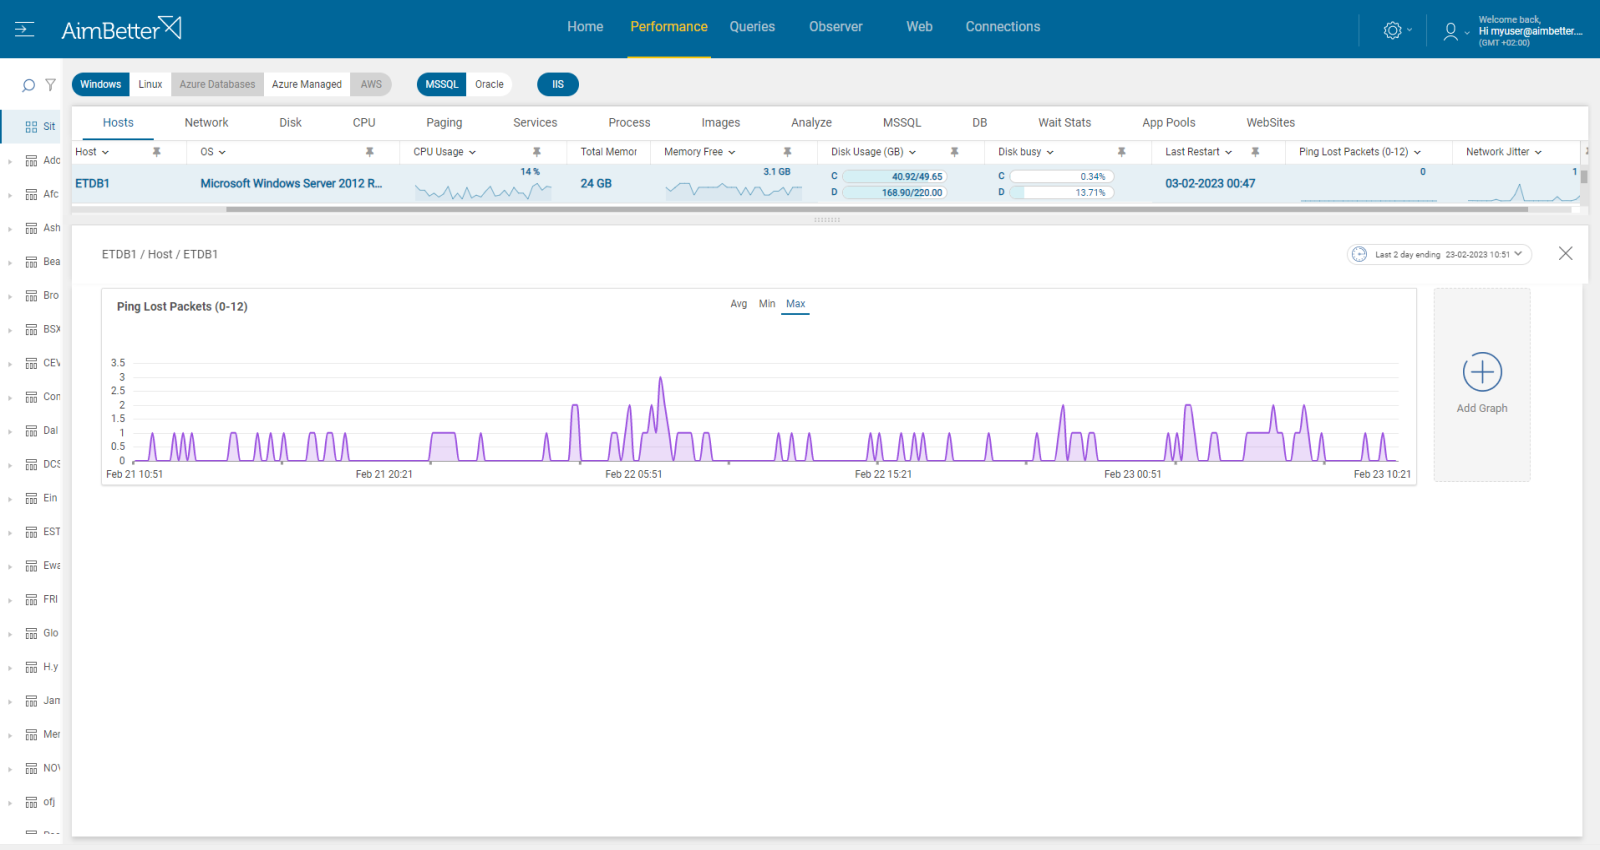
4. Look for connectivity issues with the virtual machine. It might be identified with packet loss. You can read more in this article.
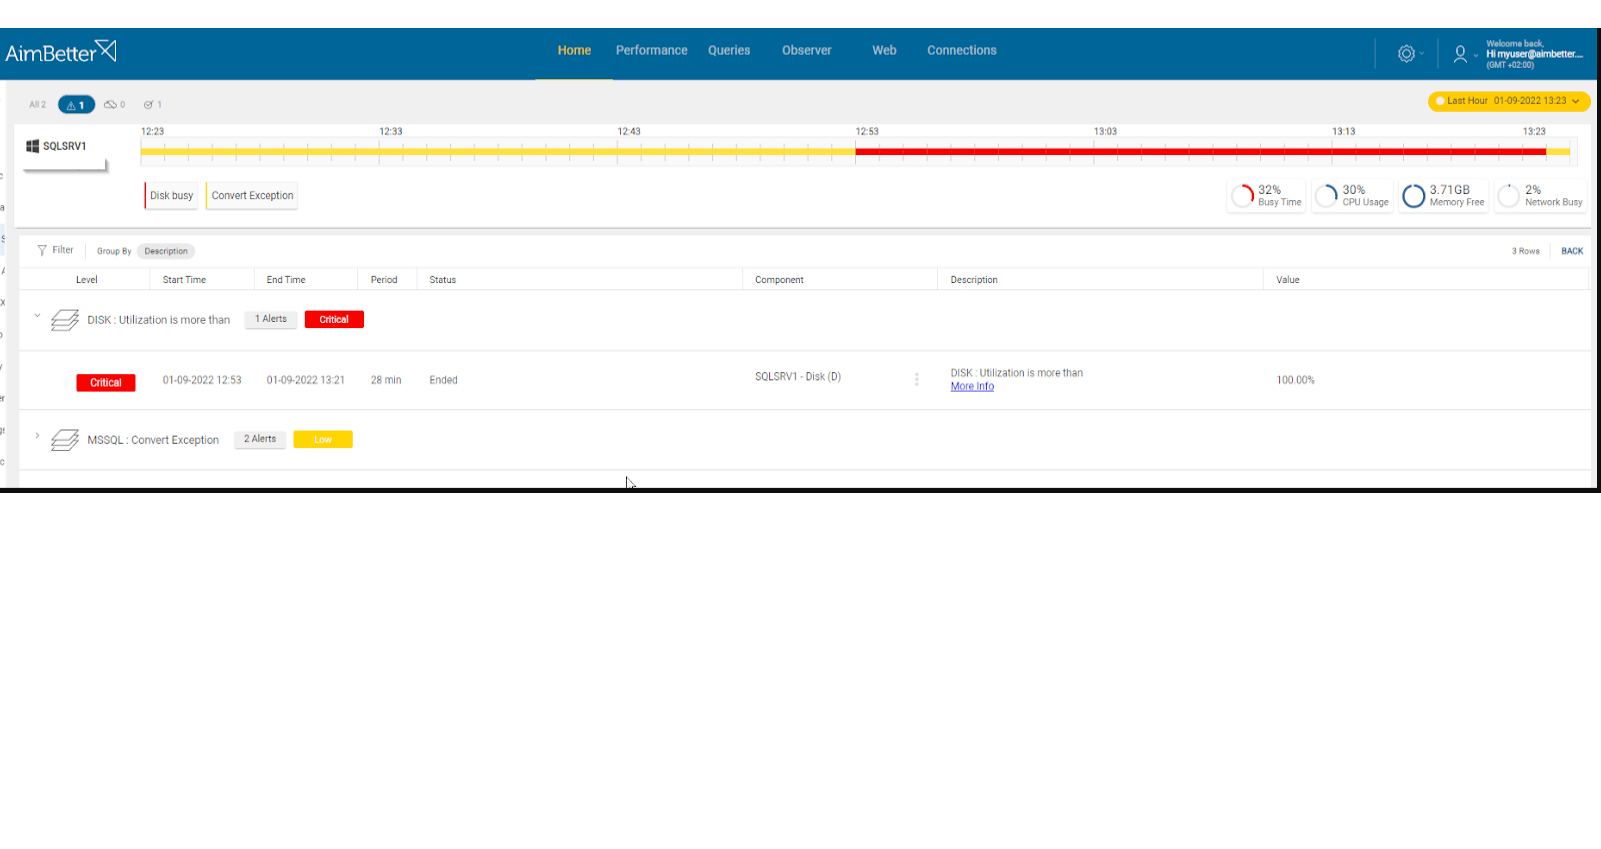
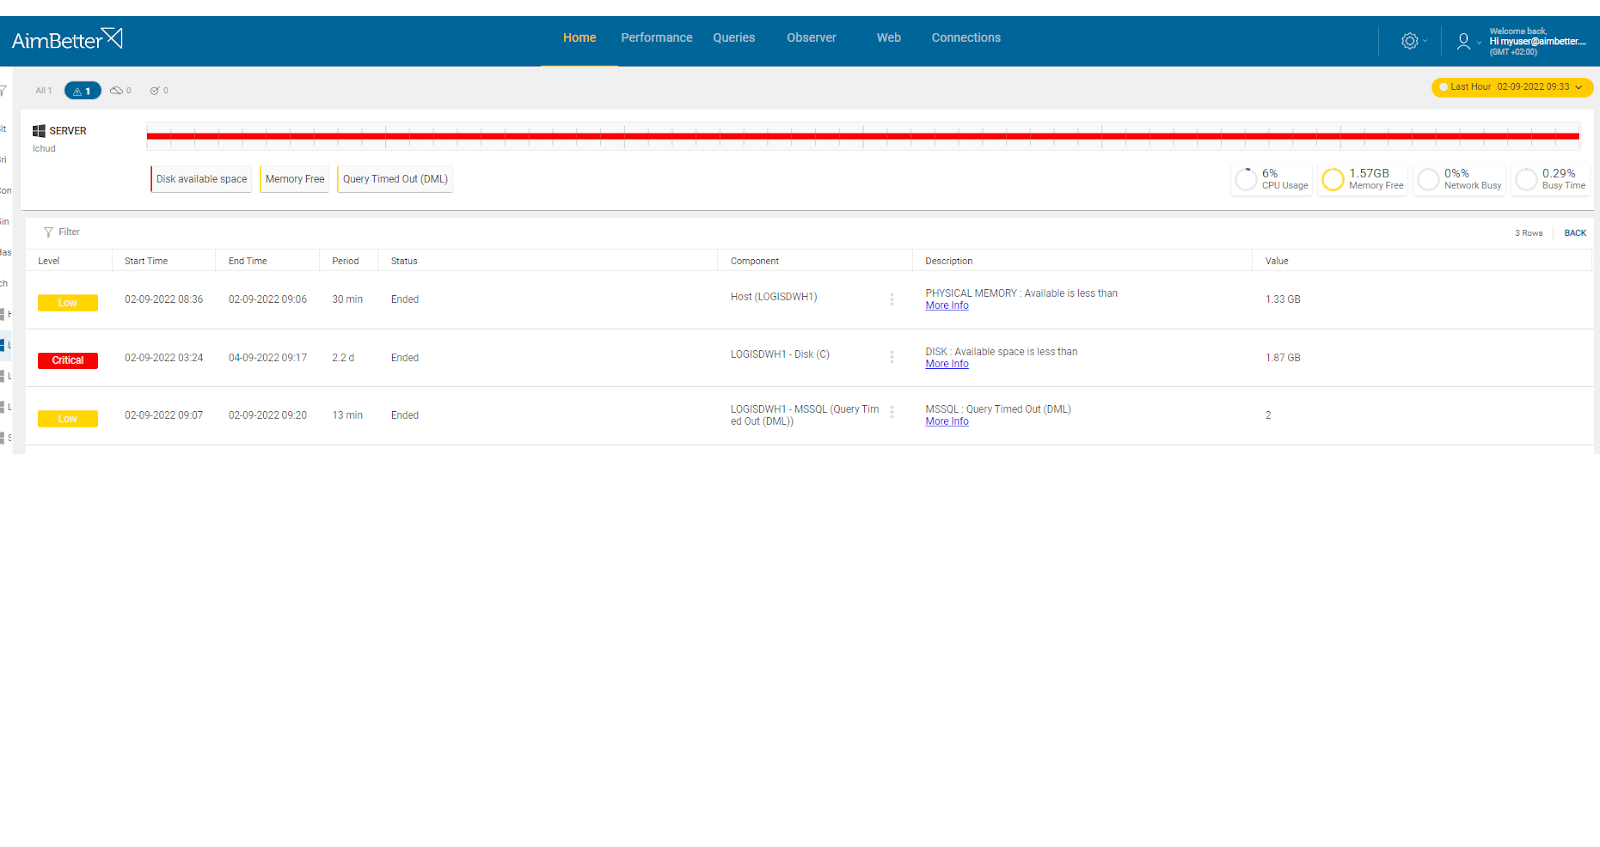
You will be immediately alerted once disk utilization is high. Alongside that, you will get notified about other events happening in parallel.
Our solution makes it easy to follow disk I/O performance and what has caused higher utilization.
Recommended action :
The faulty hardware component should be replaced immediately.
3- Running out of disk space Priority: Medium
If the program calls for output to the disk ( I/O ) and the disk is nearly full (generally, the optimal threshold is below 90% of total capacity), the disk will start to slow down as it searches for free space. This will cause the program to wait for progressively longer periods.
Problem identification:
Check if the disk free space is low and run a full scan of the disk’s content in order to locate higher data files.
1. Look for the disk available space using the file explorer.
2. Run a full scan of the disk’s content to locate its cause.
3. When finding the cause, figure out why this exact file has increased and how to prevent it from happening again. Without proper events history, it might be hard to do.
You’ll be immediately notified if there is a low disk available space!
Our solution provides easy access to finding the root cause immediately when knowing about low disk space issues.
Recommended action :
Examine the disk free-space reporting. If necessary, working with operating system reports, identify whether there is sufficient space in unnecessary files (for example, old or redundant copies of data), to delete these files and run a disk clean-up. If there is still not enough, further disk capacity must be added.)
4- SQL queries with high disk I/O Priority: Medium
When the program calls for rapid disk reads – typically when searching and analyzing random data, disk utilization will increase rapidly.
Problem identification:
Identify the queries that are highly consuming disk I/O while tracking current disk response times.
1. Identify the highly consuming disk I/O queries by running a performance analysis. You can use SQL Server Profiler for SQL Server or AWS for Oracle. This step is complicated, might take hours (or days) of work, and you can’t guarantee precise results when checking the online status with no historical events.
2. Look for a way to optimize the queries by reducing the amount of I/O utilization they retrieve or by tuning their execution plans. You should consider deleting or adding new indexes. This mission might be complicated, requiring a highly skilled DBA that can view a full SQL query plan that might be long and complicated.
3. While improving the queries, you have to follow up on this issue. If the disk I/O is still high, consider doing a further investigation or looking for other ways to improve the queries.
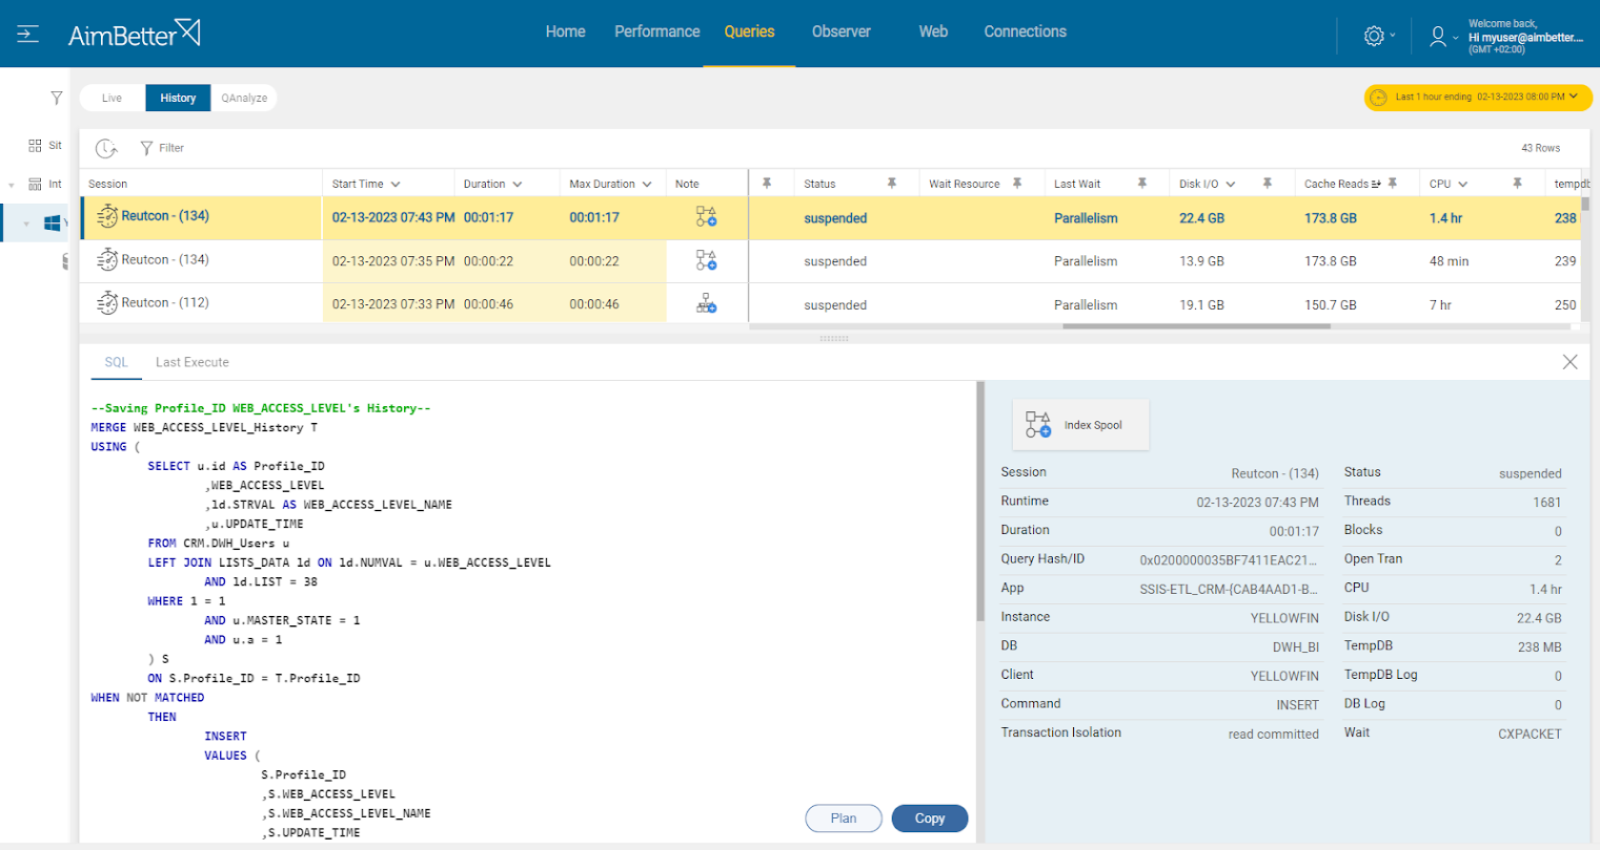
Our tool constantly collects data about queries and their I/O utilization. Therefore it’s easy to follow up and locate problematic queries constantly. Data is available for at least 30 days enabling efficient follow-up of query improvement.
Recommended action :
Optimize the query performance. This can help reduce the disk I/O consumption of each query. You should consider changing the query’s execution plan or removing and adding indexes.
Redesign program to maximize the use of indexed data. Redesign table structures to match the requirements of the programs by building indexes. Make use of temporary tables.
5- Network errors or inefficient network structure Priority: Medium
Faulty or inadequate hardware components, such as routers, controllers, and others with low bandwidth capabilities, can significantly slow down traffic.
Problem identification:
Use a network performance monitoring tool to measure network latency, throughput, and packet loss and check for errors and hardware.
1. Identify where and when the network performance is poor while using a network monitoring tool. In addition, look for times when there’s network packet loss. This task might be hard to follow.
2. Check for errors. This might take time.
3. Analyze network abnormalities, and check for network hardware and settings. Ensure that your network devices are configured for the most optimal performance and function correctly.
With our solution, you will receive an alert once there is a network packet loss along with high network utilization.
Our metrics track both network traffic resources and system errors.
Recommended action:
Investigate all hardware components with your Network Management team. You might change network settings for better performance or improve hardware providing a better bandwidth.
