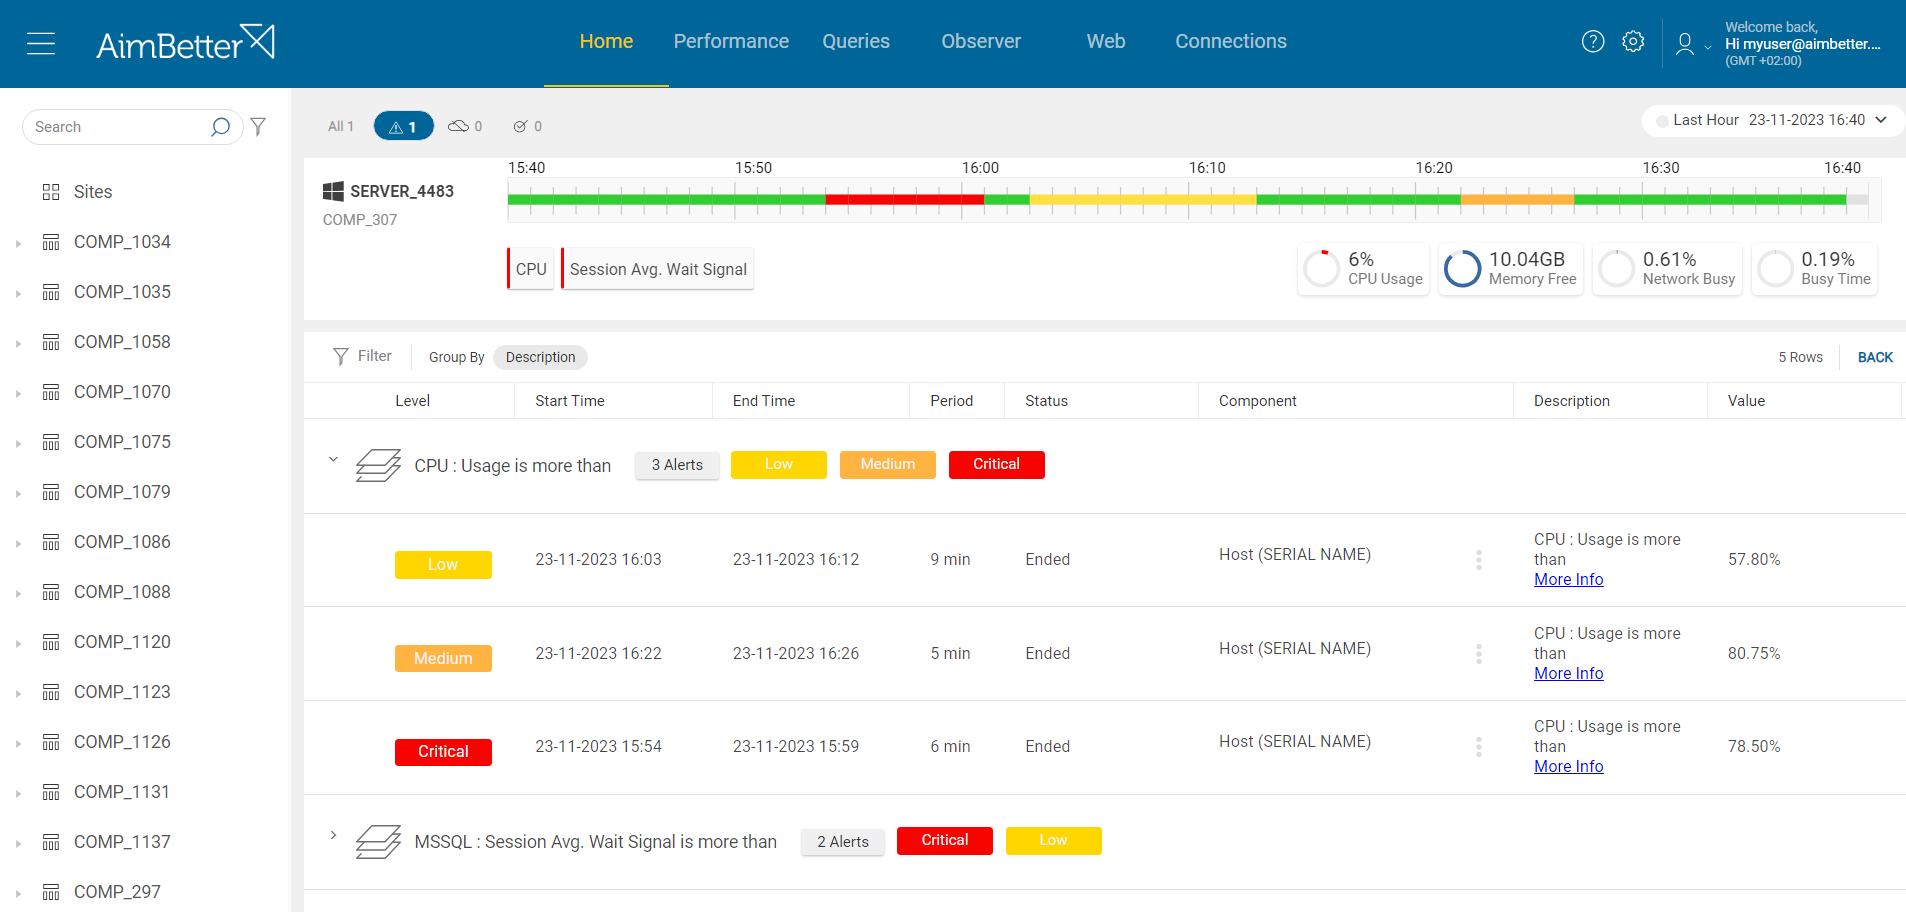
The Connection feature checks the state of connectivity to physical and logical elements inside the organization, such as files, networks, websites, and databases.
A Database Connection monitors the ability to connect to a database.
This alert notifies when a database connection attempt fails.
Currently, this feature is available only for Windows operating system servers.
Symptoms
The system may take longer than usual to load or could become completely unresponsive as it repeatedly tries to connect to the unavailable database.
Impact:
Critical databases often support essential business operations. If the connection is unavailable, the business could experience downtime, leading to financial losses, disrupted services, or missed deadlines. Regular connection testing ensures issues can be addressed proactively before they impact operations.
Expected behavior
An increase in system usage can make a database unavailable if the system is not properly designed or scaled to handle the additional load.
Find out how you can save hours of work when investigating the root cause of this issue.
Possible causes
1- High CPU, Memory, or Disk Usage. Priority: Medium
A sudden surge in users or transactions can overwhelm the database server’s resources, such as CPU, RAM, or storage. When these resources are fully consumed, the database can slow down or become entirely unresponsive.
It might also happen due to a specific application or many processes running simultaneously. These processes might be external operations such as anti-virus scans, backups, and restores from networked data stores.
In other cases, the resource settings do not fit the requirements of the instance operation; for example, there are not enough cores or disks set improperly.
Problem identification:
Check if CPU, memory, disk I/O, or network resources are highly utilized. Identify the source of the load and if it is recurrent. Try to reschedule heavy tasks to a time of low user demand.
- First, you have to identify the overload. For Windows OS, you can check the Task Manager to identify an overload of hardware resources. For Linux, you can check with the commands “top” for CPU, “free” for Memory, “iostat” for Disk I/O, “vmstat” for Virtual Memory statistics, and “load” Network.
- Use OS tracking tools such as Performance Monitor to identify which processes use hardware resources. For network activity, use a network monitoring tool to check how much traffic flows through your network and which applications or devices use the most bandwidth. Take into account that most tools help pinpoint when a problem starts, which you can’t compare to old time frames.
- Check whether the long-running query wait time is for a specific hardware resource and which hardware resource is more utilized than others while the query is running. For that, you should use tracing tools such as SQL Server profiler. This step might be completed and take time, and the result probably won’t be precise while checking only online statuses.
You will be immediately alerted if there is an issue with any hardware resource.
Comparing time frames is easy when working with a single panel, which allows you to view several metrics simultaneously, check query details, and monitor resource utilization.
Recommended action :
- Cancel unnecessary programs that cause high hardware utilization.
- Reschedule non-essential activity (e.g., virus scans, backup, etc.) to hours of lowest SQL demand when possible.
- If the increase in resource demand is expected to continue, hardware upgrading may be needed.
2- Blockings or Deadlocks. Priority: High
High transaction volumes can lead to contention where multiple users or processes try to access the same data concurrently. If many transactions lock rows or tables, it can block other processes, making a database unavailable.
In some cases, the database may experience deadlocks, where two or more processes are waiting for each other to release resources. Deadlocks can freeze the system and cause unavailability.
Problem identification:
You should identify the blocking queries before the database becomes unavailable.
- Run an overview of the files’ status in your server by manual check or get help from a diagnostic tool. Check if the disk’s used volume got bigger, and if so, recognize its source. It might be hard to do without knowing your business properties properly.
- If the source is an application, you should try to identify the source by:
- Checking application logs
- Talking to users of this application if there is a reason that files got bigger and if there might be a higher volume in work than the usual workflow
- Checking if the higher accumulation rate is due to temporary files. Some applications generate temporary files during their operation, and these may not always be cleaned up efficiently
- Checking If the issue is related to queries, you should check for it manually using profiling tools. It might be difficult since you will have only new data, and no historical data available. Therefore, identifying it depends on whether this issue will be repeated and when. You will have to be assisted by a DBA who knows how to utilize the results correctly.
- If you have recognized that this is a backup program issue:
- Track the backup process. You can search for it in the event viewer (if the accurate backup time is known) or in the logs of Database application services where the backup is done, looking for incomplete backups or timeouts. If recognized, check for missing steps in the backup process that are related to files getting overgrown. For example, if old backup files are not deleted, it will probably cause files to get bigger.
- Check older backup files and compare whether the backup files grew for the last attempts. These checks might take time and require knowledge of the current backup and data components.
- Once you recognize the right cause for the higher data accumulation rate, follow up to see if there is a change for the better when solutions are implemented.
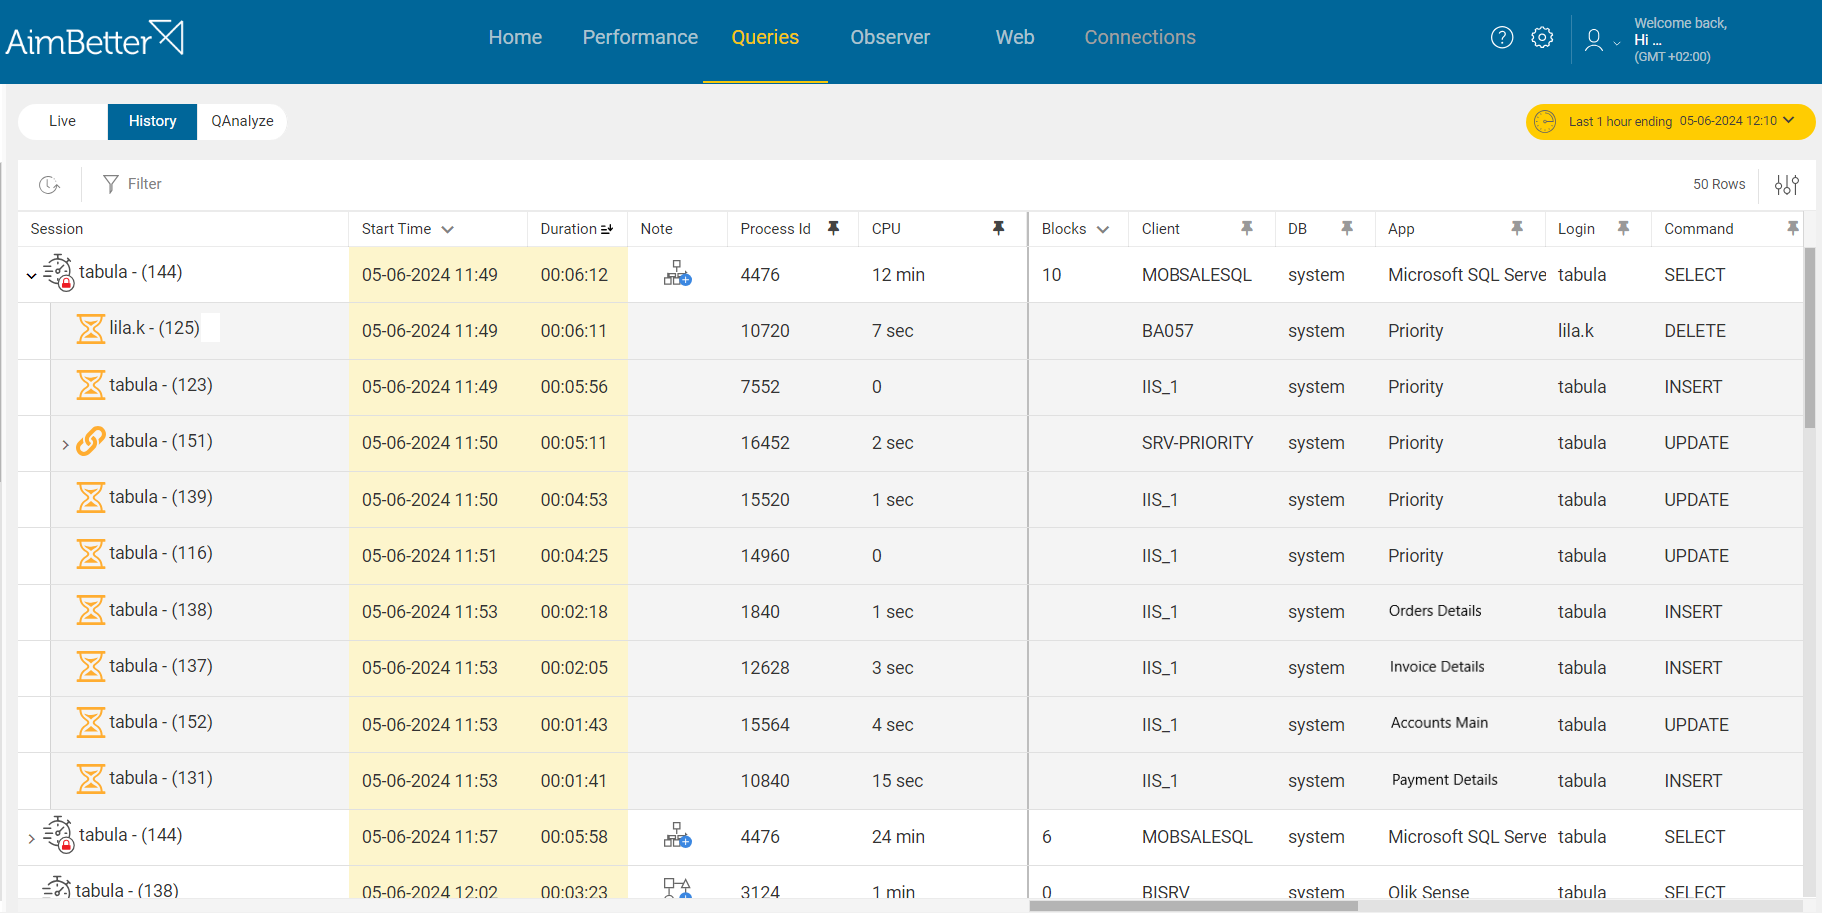
Aimbetter simplifies the investigation of activities before the DB connection failure, providing historical information about queries and enabling filtering of those that caused blocking or whose duration was above a particular time.
It also brings complete information about deadlocks in a friendly display.
Recommended action :
If the source of the issue is the application – advise the application team and check if the data accumulation is necessary or might be prevented when changing the application’s settings.
If the source of the issue is queries and/or backup-related – advise with a DBA. For tuning the performance of queries, you should read the next articles: https://www.aimbetter.com/long-query/, https://www.aimbetter.com/backup-failure/
3-Network errors or inefficient network structure Priority: Medium
Increased usage may result in higher data transfers between the application and the database. If the network infrastructure cannot handle this load, it can cause latency, packet loss, or disconnections, making the database appear unavailable to users.
Problem identification:
Use a network performance monitoring tool to measure network latency, throughput, and packet loss and check for errors and hardware.
- Identify where and when the network performance is poor while using a network monitoring tool. In addition, look for times when there’s network packet loss. This task might be hard to follow.
- Check for errors. This might take time.
- Analyze network abnormalities and check for network hardware and settings. Ensure that your network devices are configured for optimal performance and correct function.
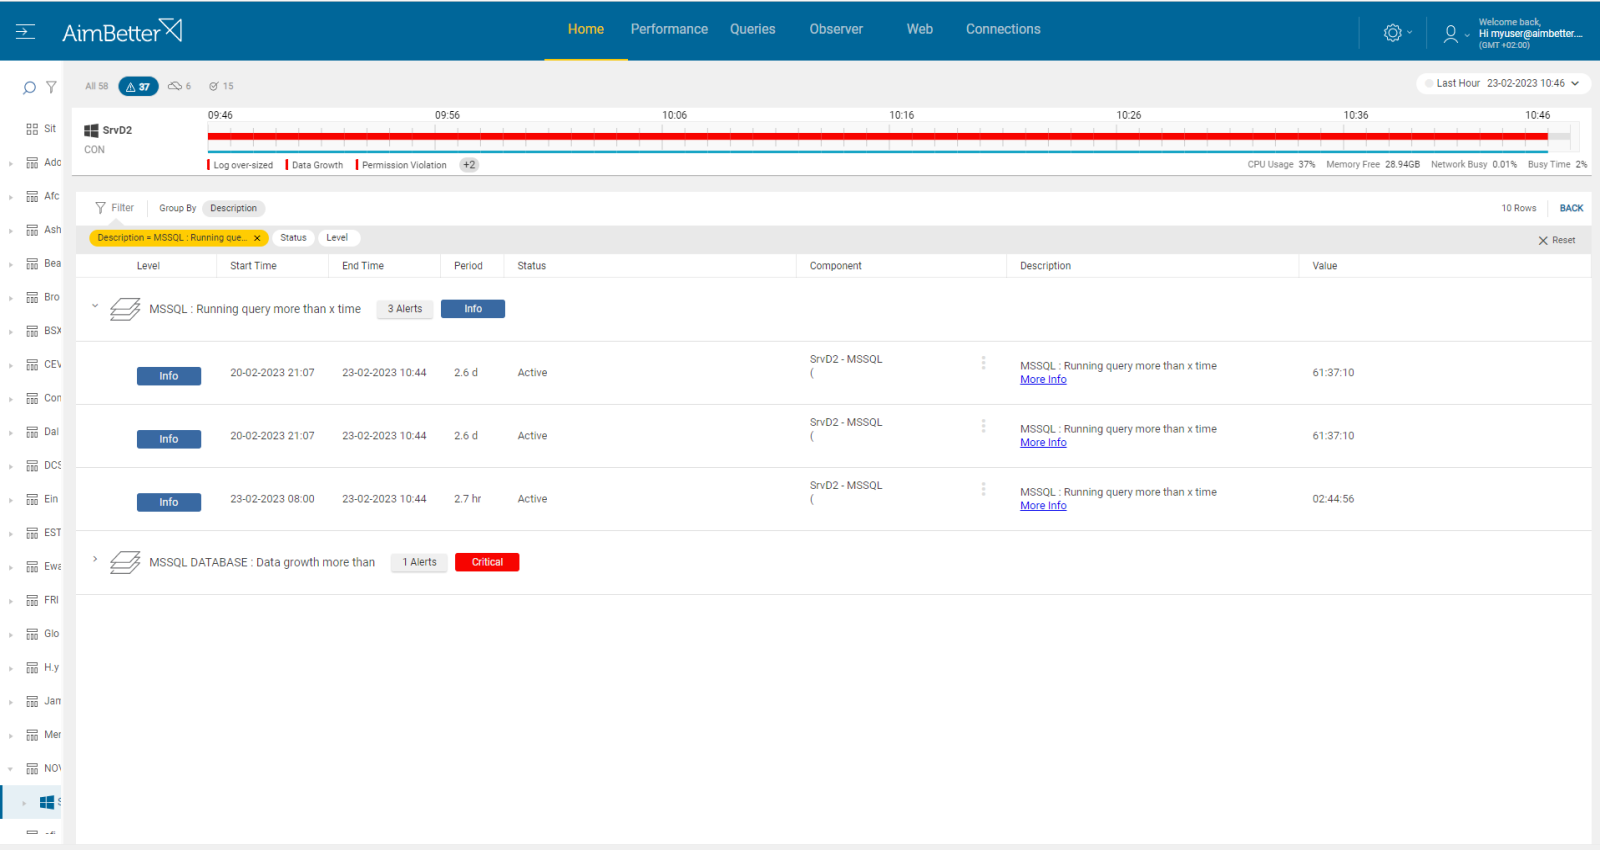
AimBetter notifies once there is a packet loss or high network utilization.
A network issue alert shall appear in its dashboard before the DB connection failure alert.
Recommended action :
Investigate all hardware components, with your Network Management team.
See our recommendations regarding network latency here.


