Analyzing query performance in real-time – Is it simple or complicated?

Software use databases to save data using queries that insert, update or refine the information.
We also know that the database is installed on a server and acts like any other system: When it performs a transaction it consumes the resources of the server, processor, memory, disk and/or a network adapter. These resources are also used by backup software, anti-viruses and of course other software. If the resources are normal and not loaded and, of course, the query is written correctly and efficiently, the query ends quickly.
But what happens when the queries respond slowly and are blocked by other queries? :
- Is the query not written correctly?
- Are these the resources the server can provide us?
- Should we add an index?
- Yesterday it worked great, what changed since then?
- Why is the system slow on a specific hour? What exactly happens during that timeframe?
- Who/what halts the system?
So we’ll try to locate the problematic queries by:
- Running the profiler – we record and analyze all the queries that run in the
suspected timeframe - Recording the system resources, using Perfmon in windows for example.
- Analyzing the Extended Event that contains a log of events in XML format.
We’ll move on to the research stage and analyze the data and then we may find the problem:
- The query is slow and not written correctly, so we will improve the code and
return to normal mode. - An Index should be added for optimization, we will create the index and then
queries will take less time to run. - The software makes frequent interactions with the database, we will make a
correction in the software code. - When the server is overloaded it means that its resources are insufficient. Should we add memory? add a CPU? Is there a process that creates a problem that we should deal with? Is an antivirus running and locking the database files or a third party backup?
The problem is that it takes several hours. It is necessary to get the IT, the development and the DBA personnel involved in order to receive the products, however, we would still lack information such as locks, the query plan or an analysis of who runs the query how many times it runs during the day and / or what runs on the server that slows it down. Maybe something scans the server or backs it up?
Also, with the basic tools that SQL provides us, the server will be working hard to extract all this information and increase the CPU, memory and disk usage, therefore lowering performance even more.
The conclusion from the detection process is that we would like to shorten and streamline it and point out the problems during an event in real-time. When we have all the necessary information to locate the source of the problem in the query. The most important thing is not to interfere with the proper operation of the system.
“In order to perform this complex task, professionals use a variety of different monitoring tools found in the market. Sometimes more than one professional is needed in order to administer and understand what the tools display.”
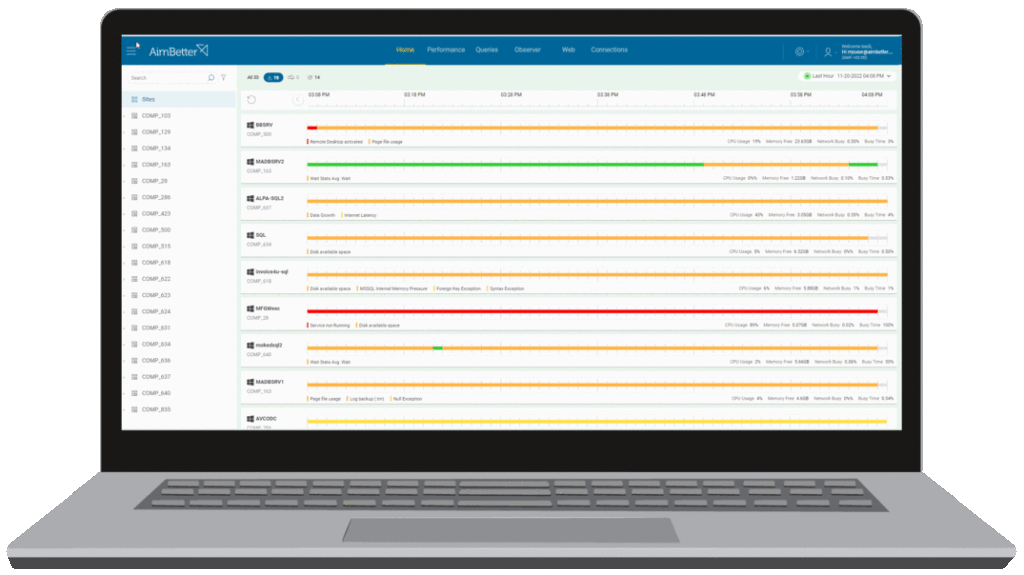
AimBetter is a system of monitoring, detection and real-time alerting of performance issues and code errors in databases, operating systems, and various hardware components.

Please feel free to request a FREE demo of AimBetter to demonstrate how it can save you time and money.
By Yehuda Lasri, CEO of AimBetter


