A blocking query in Oracle is an SQL statement that causes other queries or transactions to wait until the blocking query completes execution. Blocking occurs when one session holds a lock on a resource and another session attempts to acquire a conflicting lock on the same resource.
Blocking in Oracle is influenced by how long a query holds its locks. The duration and type of operation determine the impact on other sessions.
In Oracle, SELECT statements generally do not cause blocking because Oracle uses consistent read (multi-versioning) to provide a snapshot of data as it existed at the start of the query. This prevents read operations from being blocked by write operations, reducing contention.
For INSERT, UPDATE, and DELETE statements, locks are held on the affected rows for the duration of the transaction, not just the query. These row-level locks ensure data consistency and allow rollback if necessary. However, blocking can still occur if multiple sessions try to modify the same data simultaneously.
Without full visibility into the locking and blocking relationships, troubleshooting through code or resource optimization may be ineffective.
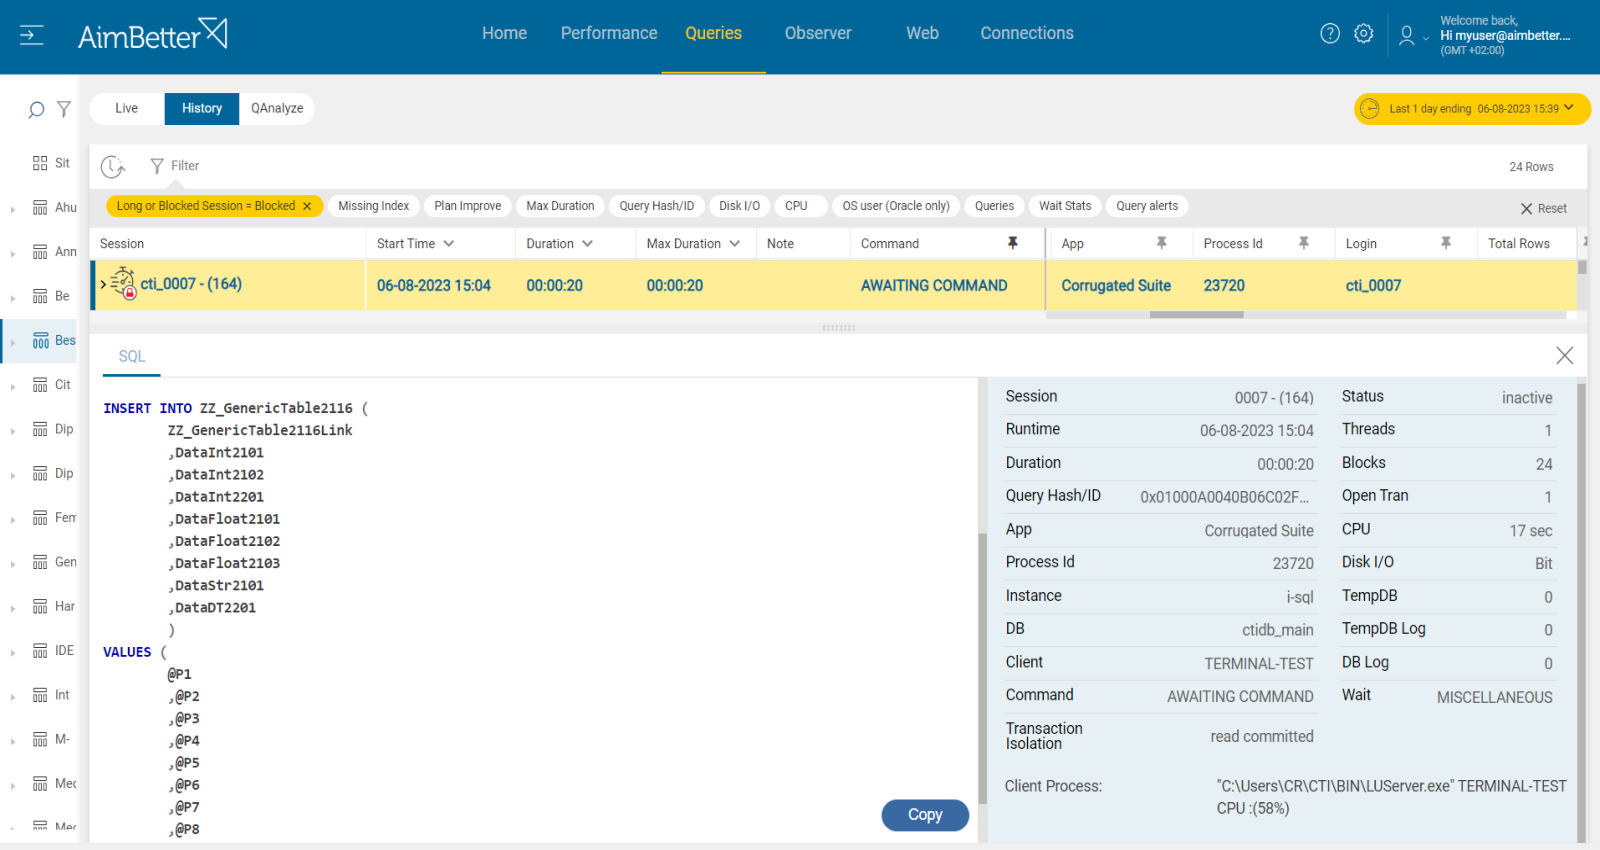
With AimBetter, IT teams gain real-time visibility into blocking queries and their root causes. AimBetter’s blocking session analysis shows which sessions are causing delays, what queries are involved, and how long the locks have been held. Unlike traditional database tools, AimBetter provides:
- Automated alerts when blocking queries exceed defined thresholds.
- Detailed session tracking, revealing the exact SQL statements and locking chains.
- Direct access to execution plans, allowing DBAs to download and analyze query plans instantly for performance optimization.
- Historical insights, allowing teams to identify recurring patterns and prevent future blocking.
Instead of manually sifting through V$SESSION, V$LOCK, and DBA_BLOCKERS, AimBetter simplifies Oracle performance monitoring, leading to faster problem resolution and improved database efficiency.
Find out how you can save hours of work when investigating the root cause of this issue.
Symptoms :
Queries are running longer than expected.
Impact: Medium
A blocking query may cause disruption to the performance of specific users trying to access the same data.
Expected behavior :
The time frame during which the first process locks the resource should be very small. When it releases the lock, the second connection is free to acquire its own lock on the resource and continue processing.
Longer blockings might interrupt the optimal business flow and may occur in parallel to an increase in usage (more transactions, queries running longer, increased disk I/O, and more).
Possible causes of long blocking queries:
1- A process is in a rollback state Priority: Medium
In Oracle databases, a query enters a rollback state when it fails to complete a data modification process due to being killed or canceled. This can occur when a client session is unexpectedly terminated, a transaction is manually rolled back, or a statement is chosen as a deadlock victim. Since rollbacks in Oracle must undo all uncommitted changes before releasing resources, long-running transactions can cause significant blocking issues, impacting database performance.
Problem identification:
Detecting transactions stuck in a rollback state can be complex, as they need to be distinguished from other blocking sessions.
- Check Oracle alert logs and trace files – These logs may contain details of rolled-back transactions and errors related to unexpected session terminations.
- Query dynamic performance views (V$ views) – Use
V$TRANSACTION,V$SESSION, andV$LOCKto identify transactions in rollback, session states, and blocking relationships. - Use Oracle Enterprise Manager (OEM) – If available, OEM can provide graphical insights into blocked sessions and long-running transactions.
- Analyze UNDO tablespace usage – Large rollbacks may consume significant undo space, leading to contention. Query
DBA_UNDO_EXTENTSto monitor rollback segment activity. - Correlate blocking events with rolled-back transactions – Use
V$LOCKandV$SESSION_WAITto analyze blocking chains and determine whether a rollback process is causing the delay.
Recommended action :
In Oracle, you cannot forcibly stop a query that is in the process of rolling back. The rollback must complete before resources are released. Attempting to intervene—such as forcefully shutting down the database—can lead to recovery mode activation, making the database temporarily inaccessible to new transactions and potentially requiring a restore.
To minimize the impact of long rollbacks, consider the following best practices:
- Avoid running large batch transactions during peak hours – Schedule intensive updates, deletions, or inserts during maintenance windows to prevent performance degradation.
- Optimize transaction management – Regularly commit changes in long-running transactions to reduce the volume of undo data.
- Monitor undo tablespace usage – Ensure that the undo tablespace is appropriately sized to handle rollbacks without excessive contention.
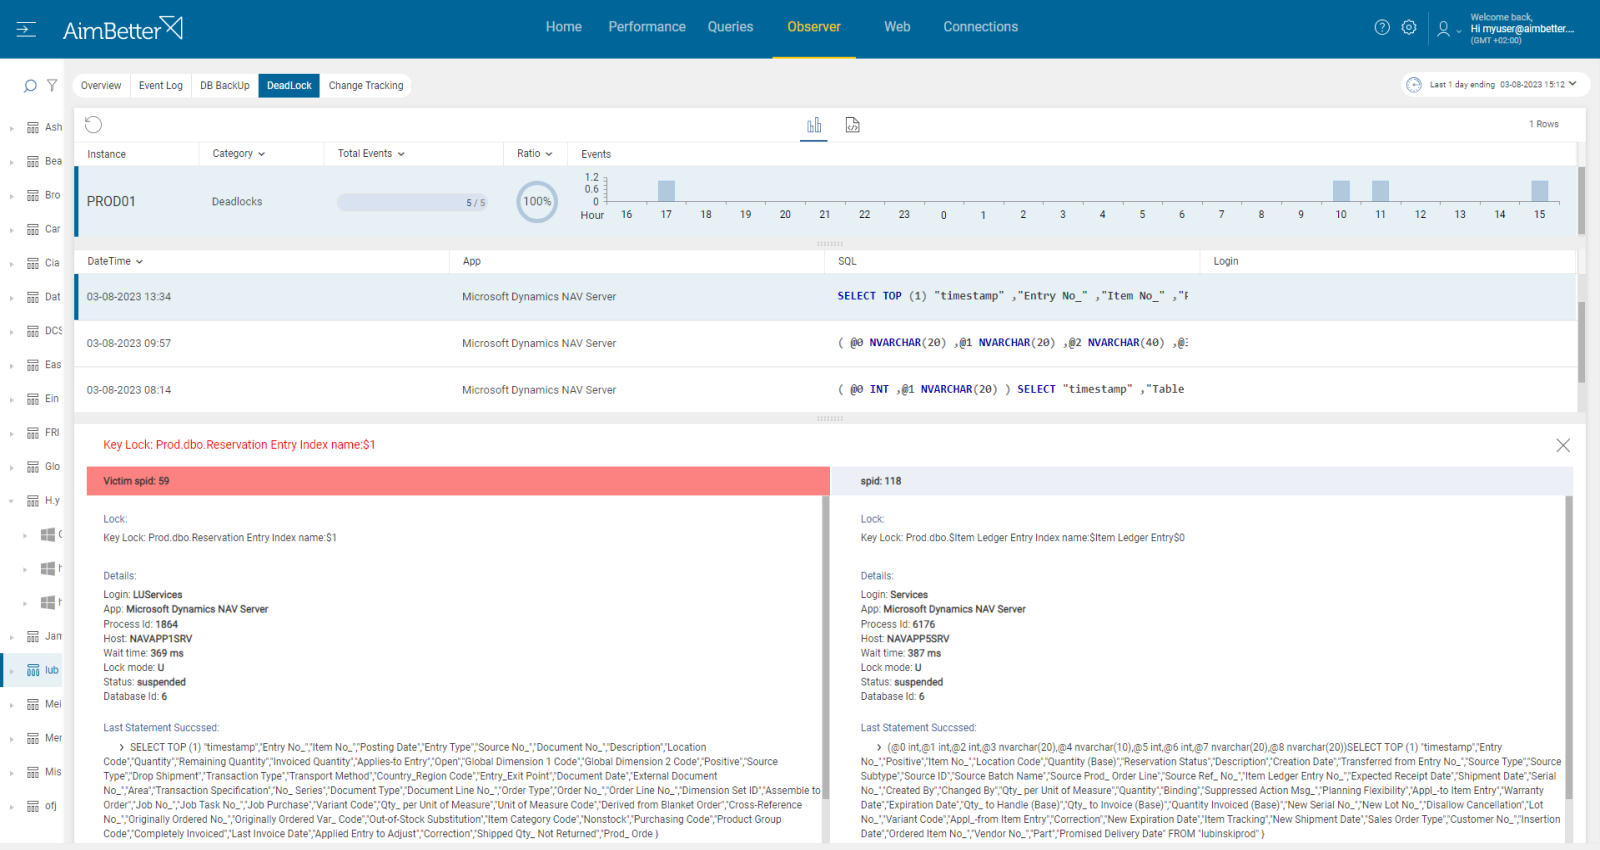
2- A distributed deadlock Priority: High
There is a key distinction between a conventional deadlock and a distributed deadlock in Oracle databases.
Deadlocks occur when multiple processes or sessions wait for resources that are held by one another within the same Oracle instance.
Distributed deadlocks happen when a query involves multiple database nodes in a distributed environment, such as an Oracle RAC (Real Application Clusters) or a federated system. In this scenario, a session may block if one node holds a lock on a resource that another node needs to proceed.
Unlike a standard deadlock, a distributed deadlock is more challenging to detect because it spans multiple database instances or external systems. Oracle’s standard deadlock detection mechanisms, such as the Lock Manager, may not always capture these conflicts, as part of the deadlock may exist outside the database engine—at the client application level or in another remote node.
Problem identification:
Identify the queries that were involved in distributed deadlocks while crossing them with blocking query.
- Check Oracle alert logs and trace files – Oracle logs deadlock events in trace files, typically under
$ORACLE_BASE/diag/rdbms/<dbname>/trace/. Look forORA-00060(deadlock detected) messages. - Use dynamic performance views (
V$ views) –- Query
V$LOCKandV$SESSIONto identify sessions holding locks and waiting on resources. - Use
V$TRANSACTIONto track pending distributed transactions. - Check
DBA_2PC_PENDINGfor any distributed transactions that are in a pending or in-doubt state.
- Query
- Enable Oracle Distributed Deadlock Detection (
DISTRIBUTED_LOCK_TIMEOUT) – This parameter helps prevent long wait times by rolling back transactions involved in distributed deadlocks. - Analyze blocking query chains – Cross-check transactions across multiple nodes using tools like
gv$lock,gv$session, andgv$sqlin an Oracle RAC environment. - Use Oracle Enterprise Manager (OEM) or AWR Reports – These provide insights into locking behavior and distributed transaction issues across nodes.
Recommended action :
To prevent distributed deadlocks in Oracle, applications must properly manage transaction nesting levels. Poorly handled transactions—especially those involving multiple nodes—can cause blocking issues when a query is canceled but still holds locks on remote resources.
To mitigate these risks, consider the following best practices:
- Optimize transaction handling – Ensure that distributed transactions follow a clear commit or rollback strategy to avoid leaving in-doubt transactions (
DBA_2PC_PENDING). - Balance resource allocation across nodes – In Oracle RAC or distributed environments, monitor and distribute workloads efficiently to prevent resource contention between nodes.
- Set an appropriate
DISTRIBUTED_LOCK_TIMEOUT– This parameter defines how long a session waits for a lock in a distributed transaction before timing out, helping to prevent long waits due to deadlocks. - Use AimBetter for real-time monitoring – AimBetter provides continuous insights into blocking queries, deadlocks, and transaction statuses across multiple nodes, helping to detect potential distributed deadlocks before they escalate.
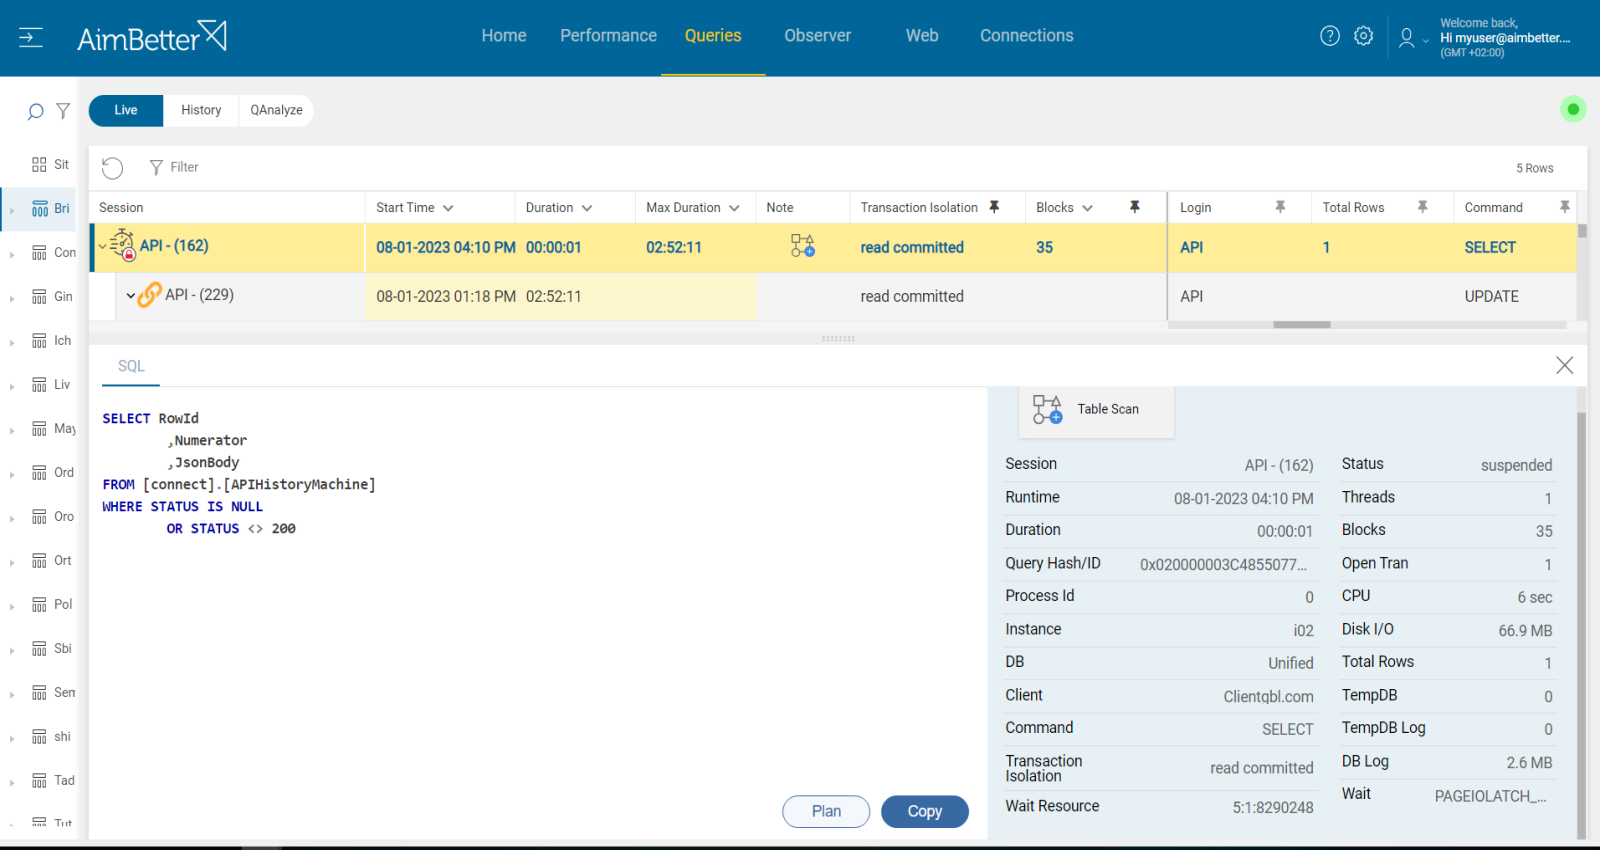
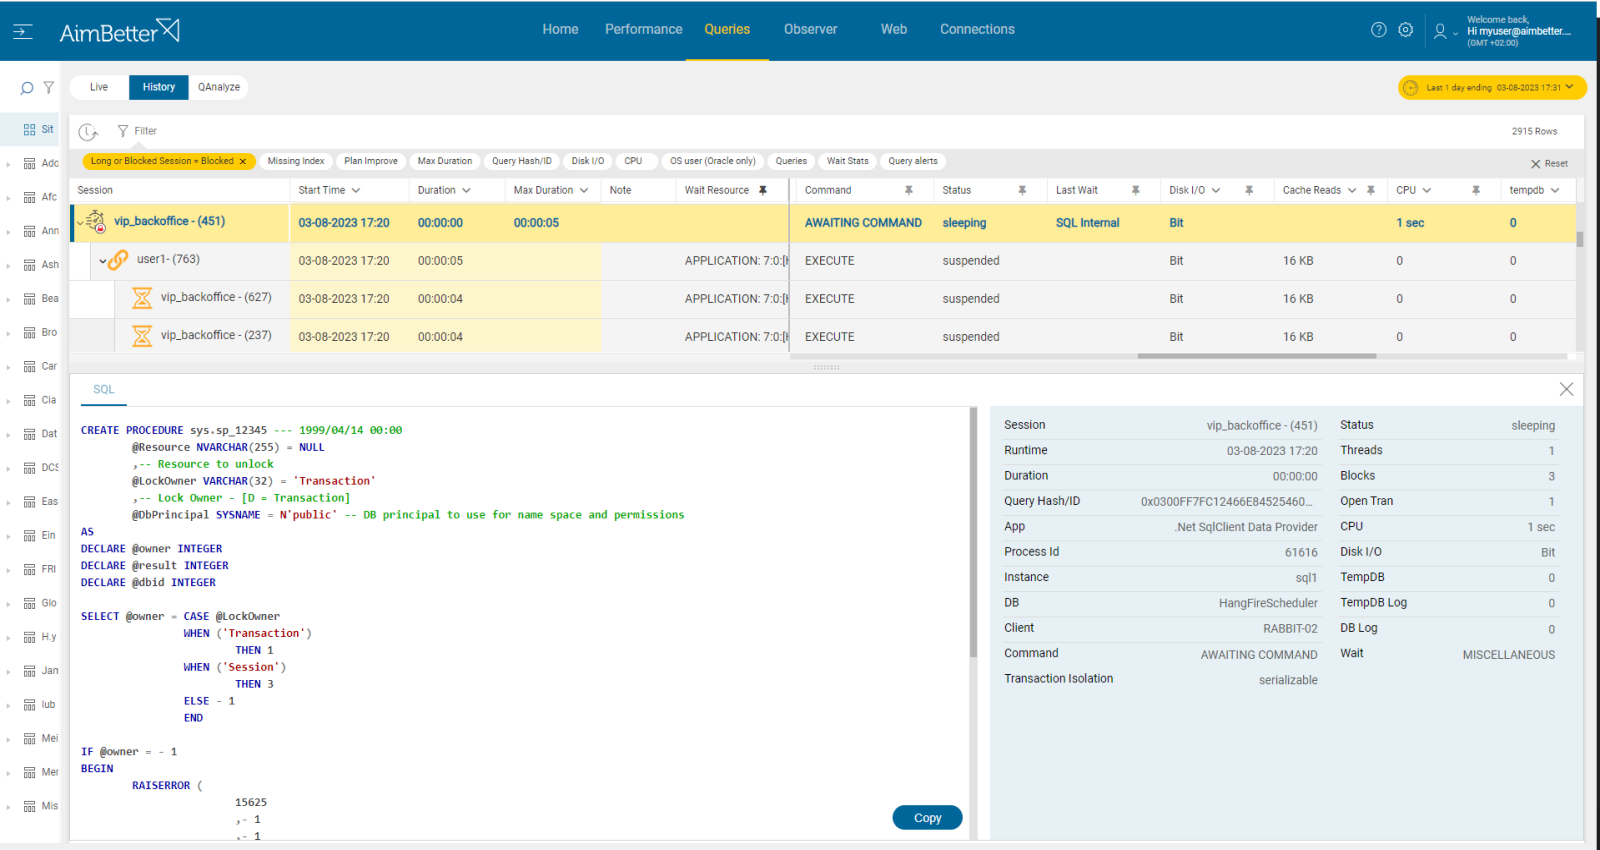
3- Unrecommended Transaction Isolation levels Priority: Low
In Oracle, transaction isolation levels play a crucial role in controlling data consistency and concurrency. While Read Uncommitted is not available in Oracle, other isolation levels—such as Read Committed, Serializable, and Repeatable Read—can contribute to blocking issues.
- Read Committed (default in Oracle) – This level prevents dirty reads by acquiring shared locks when reading data. However, it can still lead to blocking when multiple transactions try to access the same data.
- Serializable – Ensures full transaction isolation but can create significant contention, as it requires transactions to be executed sequentially in cases of conflicting updates.
- Repeatable Read – Not directly available in Oracle but can be simulated using Serializable, leading to similar blocking risks.
Problem identification:
To diagnose blocking caused by transaction isolation levels, follow these steps:
- Identify queries with restrictive isolation levels – Look for transactions running in Serializable mode or those acquiring excessive row locks.
- Cross-check with blocking events – Compare isolation level settings with blocking sources to see if restrictive locking strategies are causing contention.
- Query dynamic performance views (
V$ views) – UseV$TRANSACTION,V$SESSION, andV$LOCKto identify transactions running in Serializable mode or holding excessive row locks. - Analyze blocking queries – Query
DBA_BLOCKERSandDBA_WAITERSto find blocking sessions and determine if transaction isolation levels are contributing to the issue. - Monitor database logs – Check Oracle alert logs and trace files for blocking events and transaction details.
- Use
AUTOTRACEandEXPLAIN PLAN– Analyze execution plans of queries to see if restrictive isolation levels are causing unnecessary contention. - Assess overall database workload – Review system performance metrics (
V$SYSSTAT,V$SESSION_WAIT) to determine if transaction isolation settings are impacting concurrency and resource utilization.
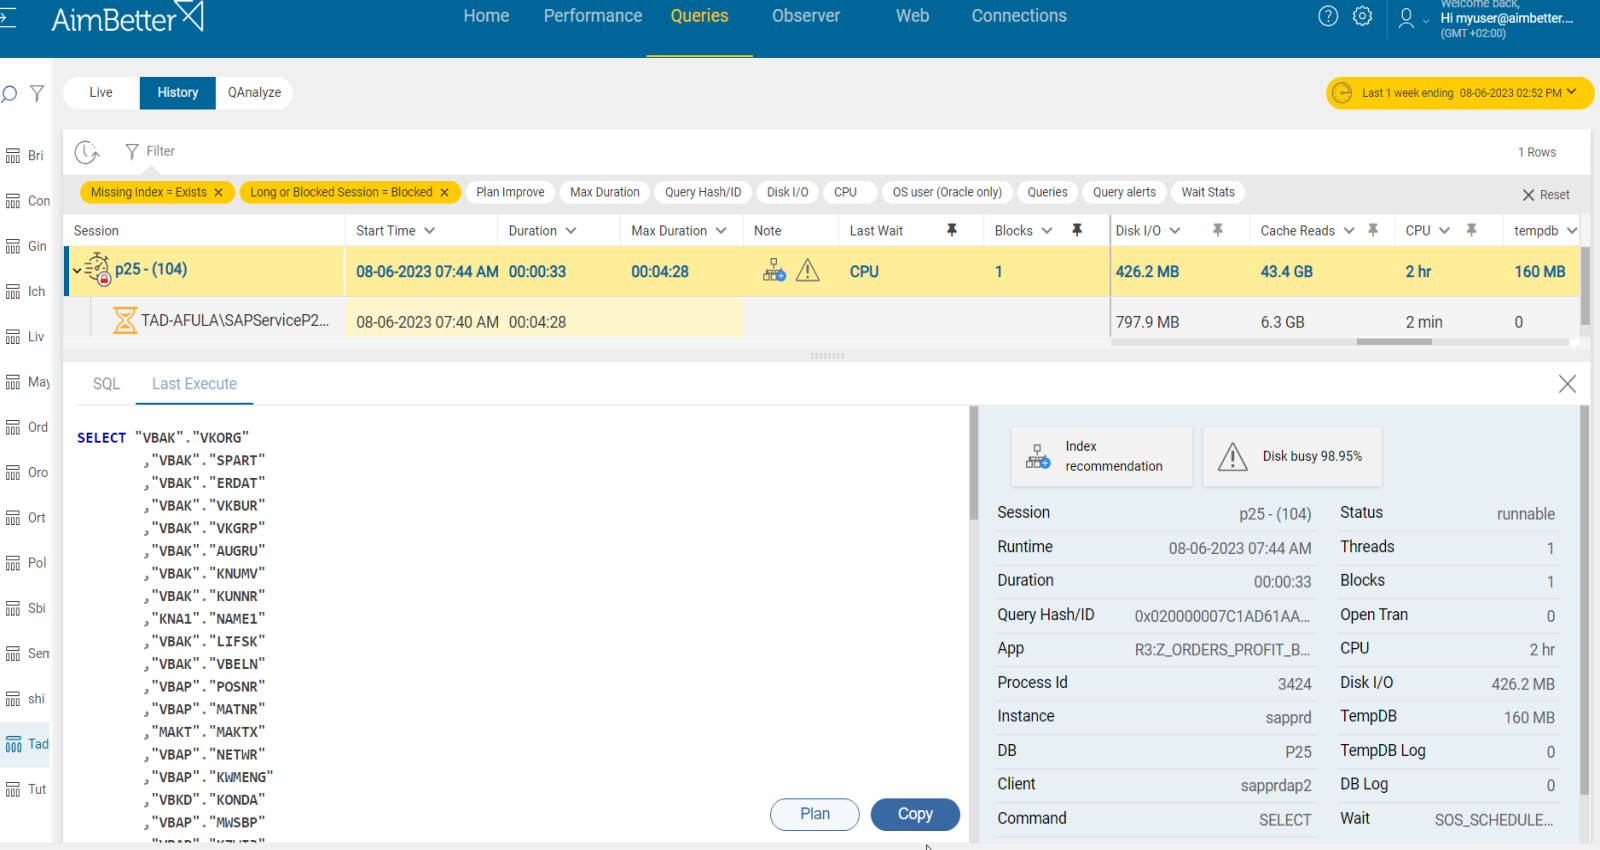
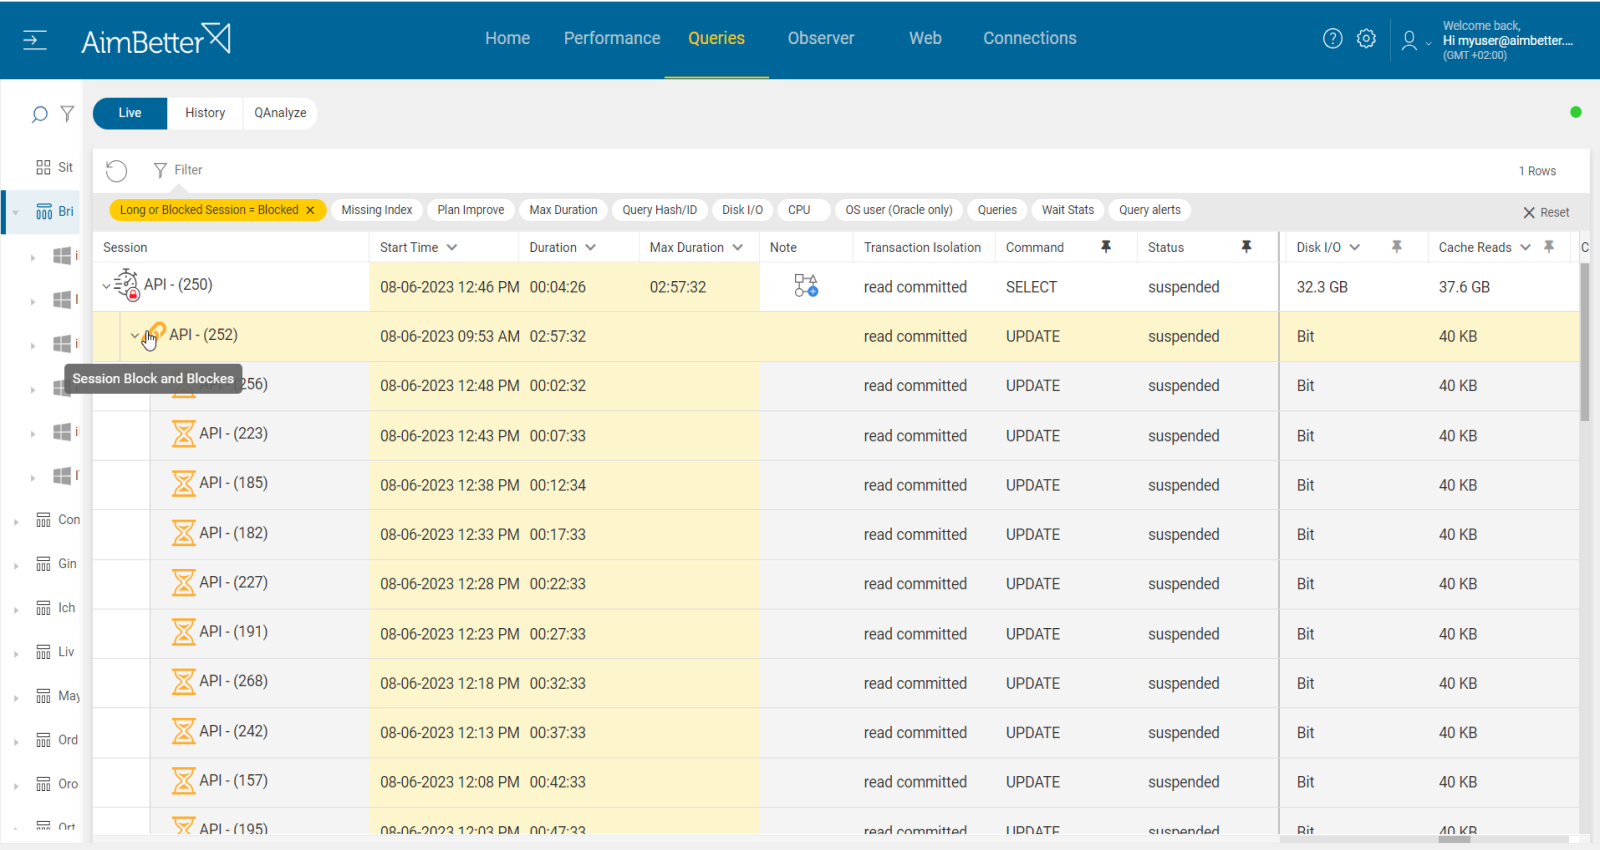
4- Query with a long execution time in active or idle state Priority: High
In Oracle databases, long-running queries can hold locks on critical resources (such as tables, rows, or indexes) for extended periods, leading to significant blocking issues.
Additionally, inactive (sleeping) sessions that still hold locks can contribute to blocking. These sessions may appear idle but still have uncommitted transactions, preventing other queries from executing.
Problem identification:
To diagnose blocking caused by long-running or idle queries, follow these steps:
- Identify long-running active queries – Look for queries that have been executing for an unusually long time while holding locks on database objects.
- Detect sleeping or idle sessions with open transactions – These sessions may not actively execute commands but still hold locks, causing blocking for other queries.
- Cross-check with blocking query events – Compare long-running queries and idle sessions with current blocking events to determine their impact on performance.
-
Monitor long-running queries using dynamic views – Query
V$SESSIONandV$SQL_MONITORto find active sessions running for an extended period. -
Identify idle sessions holding locks – Query
V$SESSIONandV$TRANSACTIONto find inactive sessions with open transactions. These sessions may appear idle but still hold locks, causing potential blocking. -
Check blocking sessions and lock dependencies – Use
V$LOCKandDBA_BLOCKERSto find which sessions are blocking others. This helps pinpoint which session is causing the delay. -
Analyze SQL execution plans – Run
EXPLAIN PLANto check if the query has inefficient operations causing prolonged execution times. -
Monitor system logs and performance metrics – Check Oracle alert logs and session history (
DBA_HIST_ACTIVE_SESS_HISTORY) for queries consuming excessive resources.
Recommended action :
Blocking queries in Oracle should be optimized, as they often indicate broader performance issues such as missing statistics, insufficient indexing, or inefficient execution plans.
To mitigate these issues:
- Optimize long-running queries – Analyze execution plans using
EXPLAIN PLANandDBMS_XPLAN.DISPLAY_CURSORto identify inefficient operations. Consider adding indexes, rewriting queries, or partitioning large tables to improve performance. - Ensure proper transaction management – Applications must handle transaction nesting levels correctly to avoid situations where a query is canceled while an open transaction still holds locks, leading to prolonged blocking.
- Gather and maintain optimizer statistics – Use
DBMS_STATS.GATHER_SCHEMA_STATSto update statistics, ensuring that Oracle’s query optimizer makes informed execution plan decisions. - Review indexing strategy – Check for missing or inefficient indexes that could be causing full table scans and extended query execution times.
- Implement session timeout controls – Configure
RESOURCE_LIMITandINACTIVE_SESSION_TIMEOUTto automatically close long-idle sessions that may hold locks.
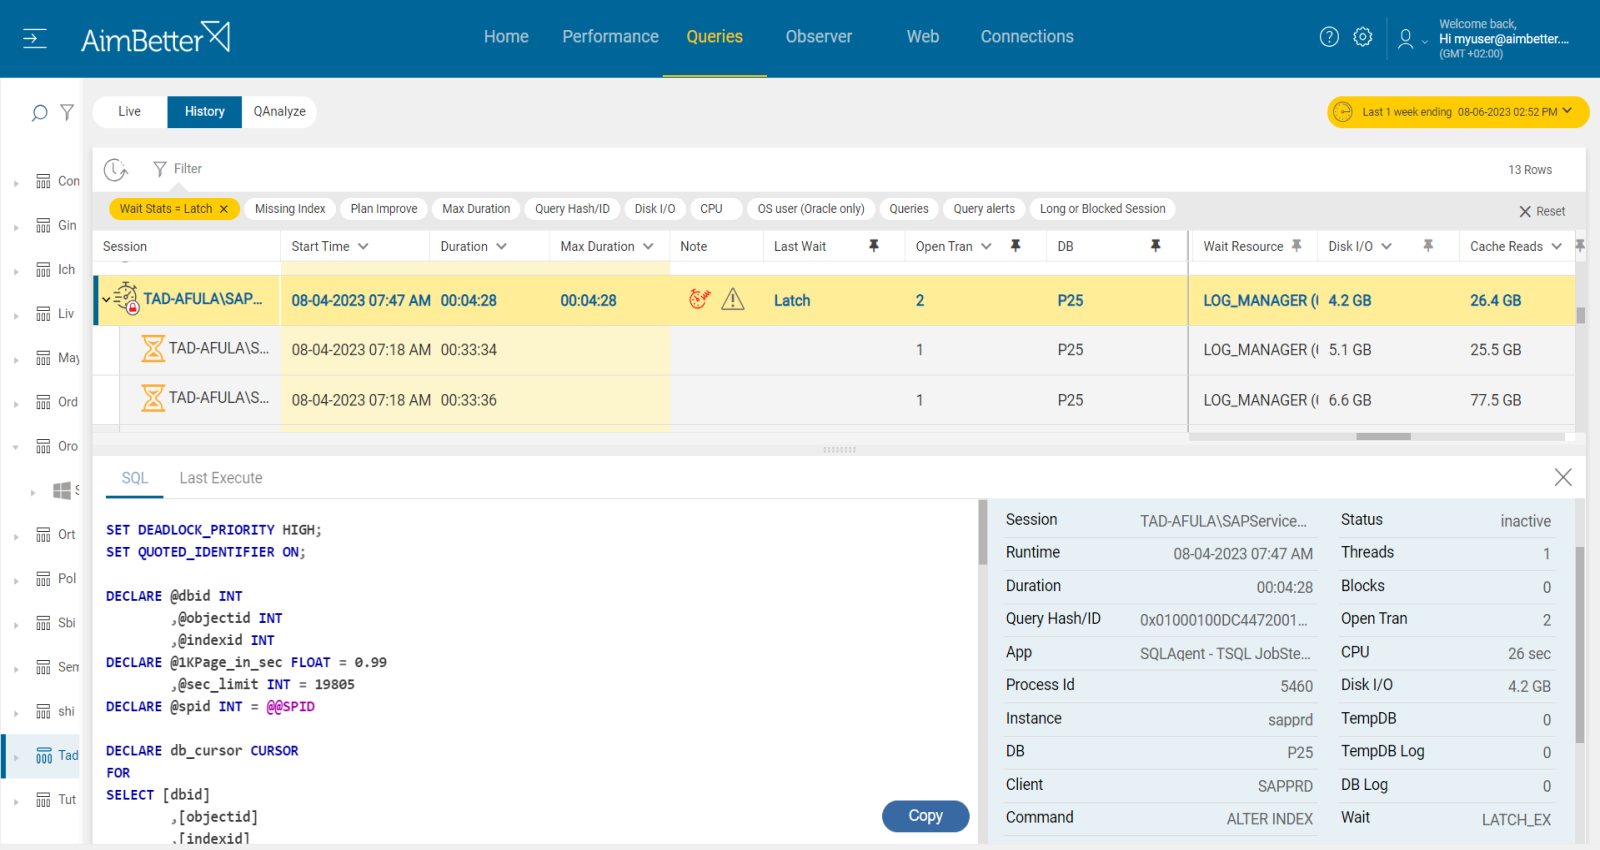
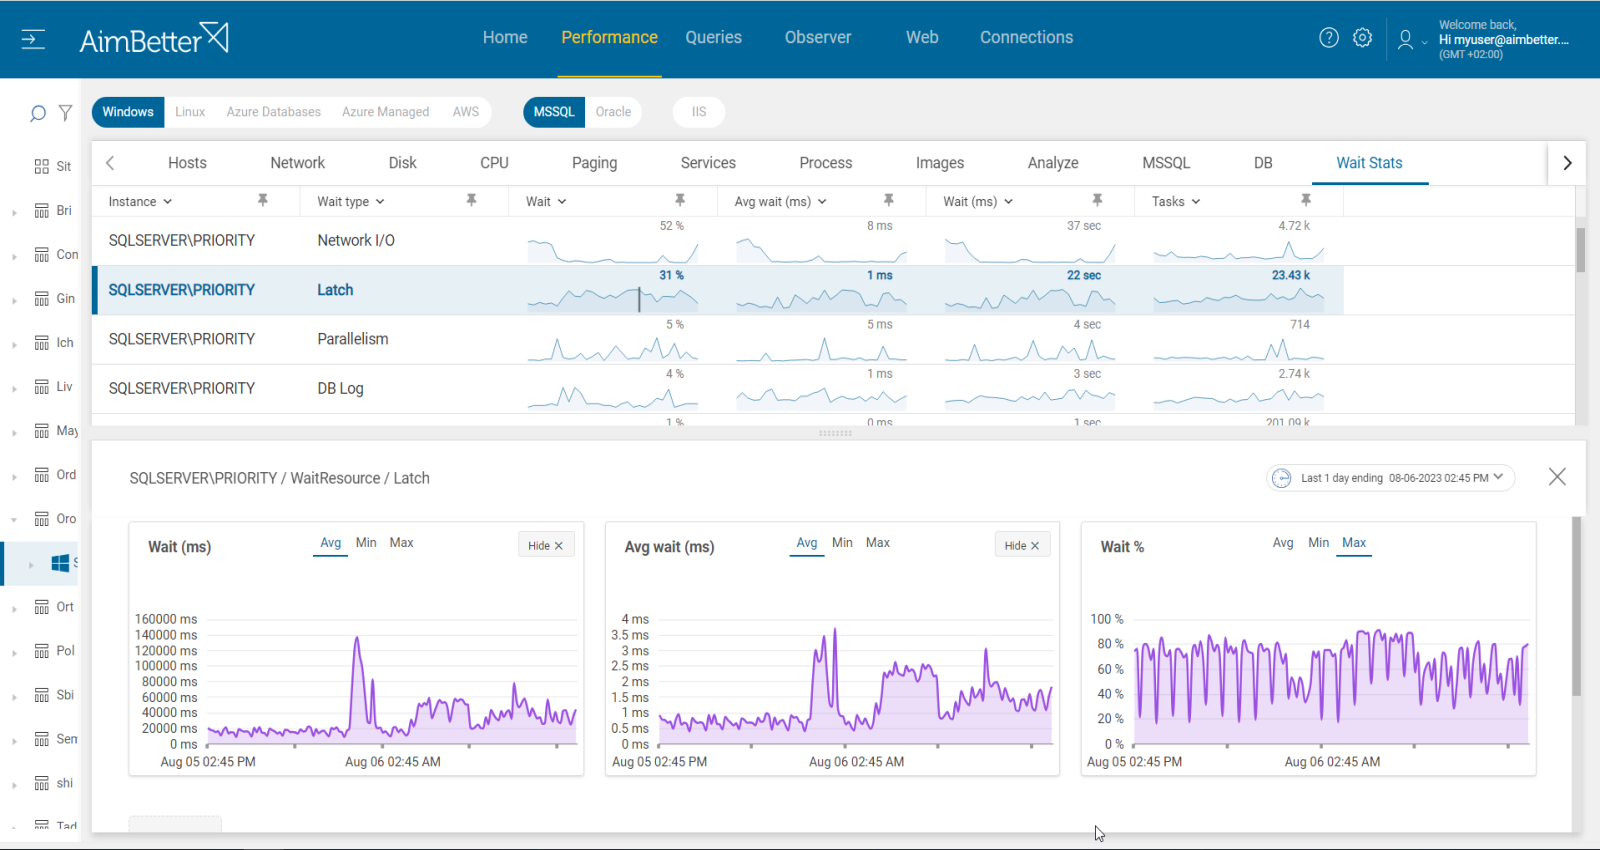
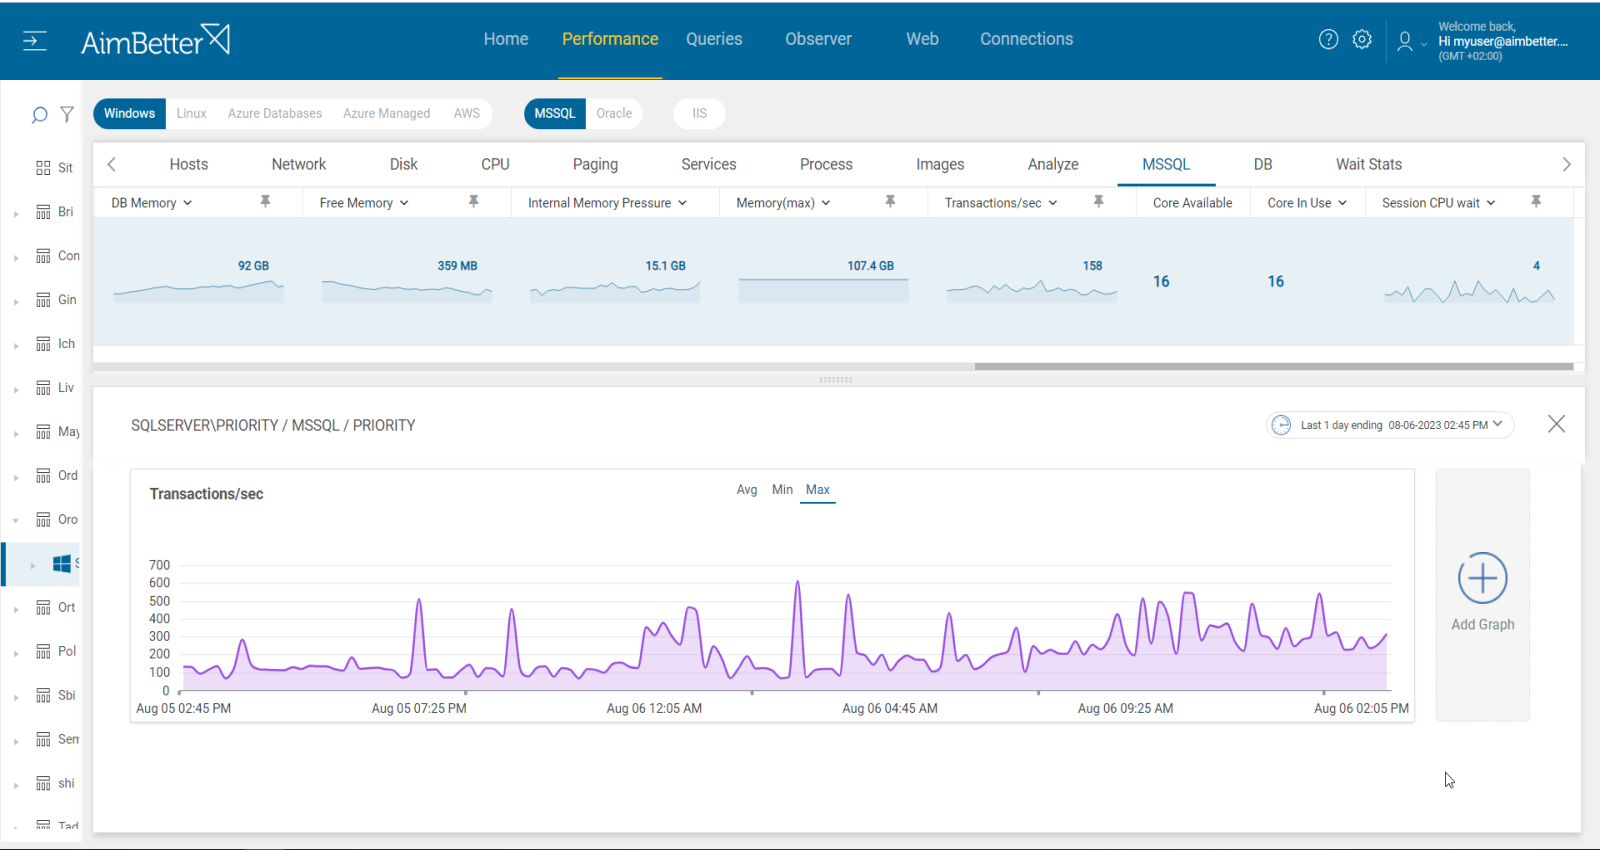
5- Latch contention while transaction per second decreases. Priority: Medium
In Oracle, latches are low-level synchronization mechanisms that protect shared memory structures such as buffers, redo logs, and internal metadata. When multiple CPU cores and sessions compete for access to these resources, latch contention can occur, leading to performance degradation and blocking.
A well-performing system should exhibit a balanced correlation between the number of transactions, latches, and CPU usage. However, when transactions per second decrease while latch waits increase, it often signals a bottleneck caused by contention. This can be exacerbated by high I/O activity, leading to excessive latch waits on critical database structures.
Problem identification:
- Monitor latch waits – Identify specific latch types with high contention and check their impact on transaction throughput.
- Analyze CPU utilization – Ensure the system has an adequate number of CPU cores and that they are being effectively utilized (Oracle databases with 16+ cores may experience scalability issues if contention arises).
- Correlate I/O activity – Increased I/O operations can lead to higher latch contention, especially on redo logs or buffer cache latches.
-
Identify Latch Contention – Query
V$LATCHandV$LATCH_PARENTto check latch waits and their impact on performance. High “misses” and “sleeps” values indicate contention. UseV$LATCH_CHILDRENfor detailed latch contention analysis – This helps pinpoint which latch is experiencing delays. -
Analyze Transaction Throughput – Check if transactions per second are decreasing while latch contention increases. If transactions decrease while latch waits increase, it indicates contention.
-
Examine CPU Utilization – Verify CPU usage with
V$OSSTAT. If CPU cores are underutilized while latch waits rise, a bottleneck exists. -
Check I/O Bottlenecks – Review redo log and buffer cache contention in
V$SYSTEM_EVENT.This helps pinpoint which latch is experiencing delays. Look for latch: redo allocation and latch: cache buffers chains, which indicate contention on redo logs or data buffers.
Recommended action :
When identifying that blocking queries are caused by latch contention wait events, consider improving overall query performance to reduce contention.
- Optimize Queries – Identify inefficient SQL statements by analyzing execution plans using
EXPLAIN PLANorDBMS_XPLAN.DISPLAY_CURSOR. Look for full table scans, unnecessary joins, or inefficient indexing. - Check for Missing Indexes – Use
DBA_INDEXESandDBA_IND_COLUMNSto verify whether critical columns used in queries have appropriate indexes. - Review Database Design and Settings – Ensure that tables, partitions, and storage structures are optimized for high-concurrency workloads.
- Tune Latch-Heavy Queries – If queries frequently access shared memory structures (such as buffer cache or redo logs), consider batching transactions or restructuring queries.
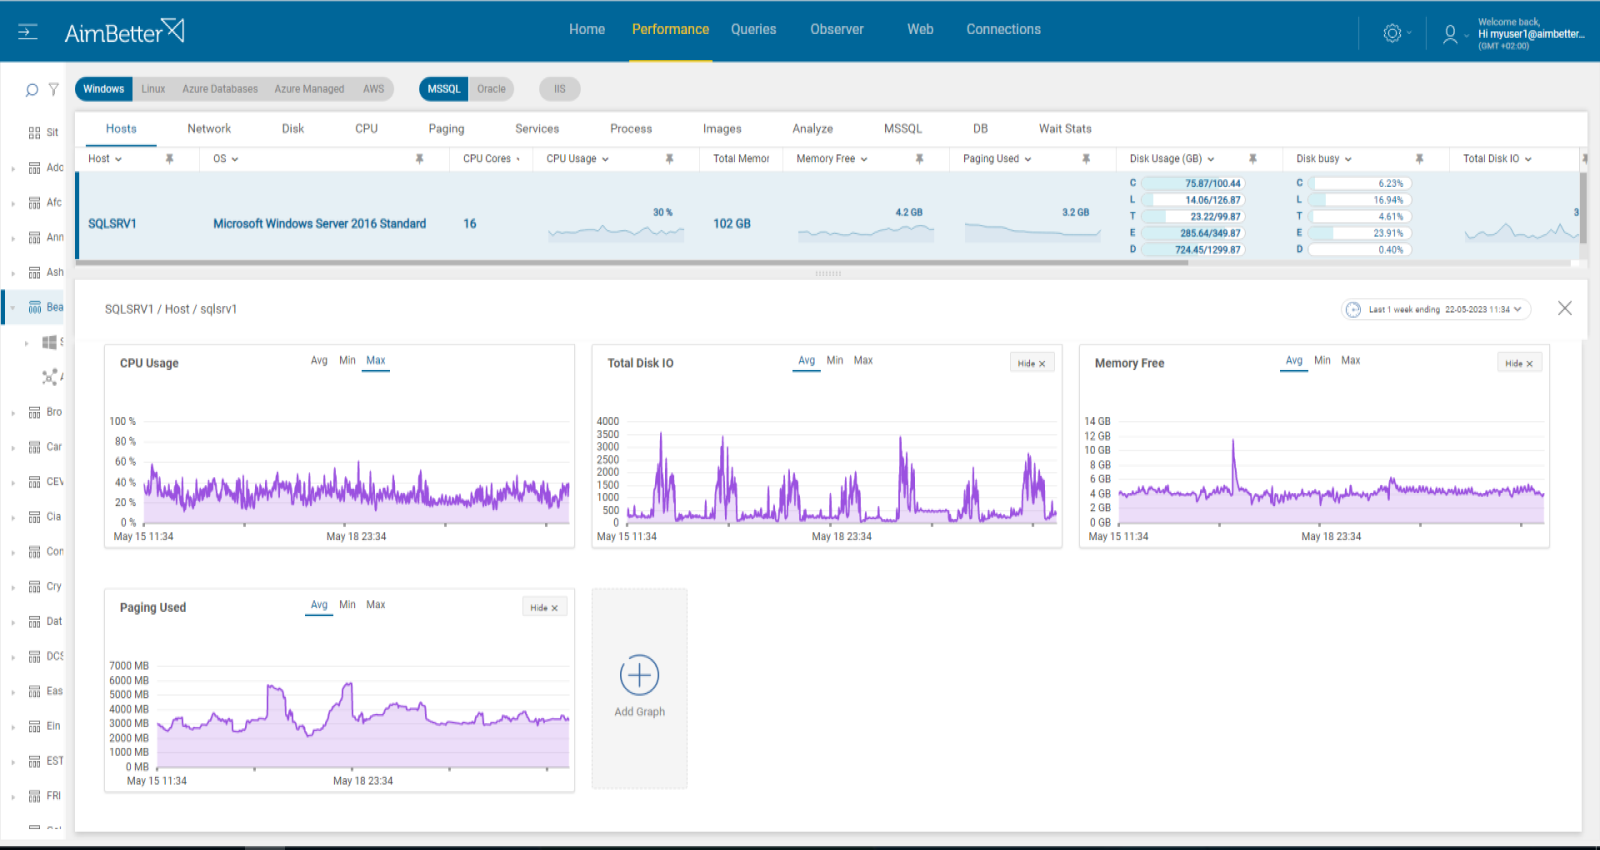
6- Overloaded or misconfigured hardware resources. Priority: High
Server resource constraints—such as high CPU usage, memory shortages, excessive disk I/O, or network congestion—can slow down query execution. This can happen due to:
- Heavy workloads from database queries, background jobs, or maintenance tasks.
- External processes such as antivirus scans, backups, or system updates consuming significant resources.
- Insufficient hardware configurations (e.g., too few CPU cores, slow disks, or inadequate memory allocation).
When system resources are overutilized, Oracle may struggle to allocate necessary resources for queries, leading to long-running transactions, increased lock contention, and blocking queries.
Problem identification:
Check if CPU, memory, disk I/O, or network resources are highly utilized. Identify the source of the load and if it is recurrent. Try to reschedule heavy tasks to a time of low user demand.
-
Identify High-Resource-Consuming Queries – Find active sessions consuming excessive CPU or memory.
-
Reschedule Heavy Tasks – Identify scheduled jobs running during peak hours. If heavy tasks (e.g., backups, batch jobs) overlap with business hours, reschedule them for off-peak times.
-
Check for External Processes Affecting Performance – Review OS-level processes consuming CPU, memory, or I/O (via
toporvmstatin Linux,Task Managerin Windows). Ensure antivirus scans, OS backups, and other system processes do not interfere with Oracle workloads.
Recommended action :
- Optimize query performance – Tune expensive queries using
EXPLAIN PLANand indexing strategies. - Adjust hardware configurations – Ensure CPU cores, RAM, and storage configurations match Oracle workload demands.
- Tune memory allocation – Adjust
SGA_TARGET,PGA_AGGREGATE_TARGET, andDB_CACHE_SIZEsettings for optimal performance. - Balance I/O workloads – Implement ASM (Automatic Storage Management) or distribute database files across multiple disks to prevent bottlenecks.
- Monitor system load trends – Regularly check resource usage patterns to detect recurring spikes and adjust schedules accordingly.
By optimizing hardware resource allocation and workload distribution, Oracle databases can avoid performance bottlenecks, reduce blocking queries, and improve overall transaction efficiency.


