1- High Disk Utilization. Priority: Medium
A constantly busy disk may indicate that the storage capabilities cannot keep up with the database’s demand. This happens when the speed of reading from or writing to storage (Input or Output) is slower than the database’s requirements. This situation causes queries and processes to wait more time than they should to finish their execution.
Problem identification:
Users might complain that reports take longer to finish than usual or get stuck and stopped while executing them. Identify the source of the load and if it is recurrent. Try to reschedule heavy tasks to a time of low user demand.
- First, you have to identify the overload. For Windows OS, you can check the Task Manager to identify an overload of hardware resources. For Linux, you can check with the commands “top” for CPU and “iostat” for Disk I/O.
- Use OS tracking tools such as Performance Monitor of Windows OS to identify which processes use hardware resources. In that case, most tools help pinpoint when a problem starts, which you can’t compare to old time frames. Else, If the problem is not system-originated, but database queries-originated – you can use AWR (Automatic Workload Repository) Reports, look for db file sequential read/db file scattered read/log file sync/log file parallel write/direct path read/write.
- You can also use V$ views. Use the V$SESSION_WAIT, V$SYSTEM_EVENT, and V$FILESTAT views to gather real-time and historical data about I/O wait events. You can also check V$IOSTAT_FILE and V$IOSTAT_DISK , which provide disk performance statistics.
- Whether the problem is queries or system resources, try to specify which processes cause the problem. This step might be completed and take time. The investigation process will probably not be user-friendly since several applications are used when only searching for one problem.
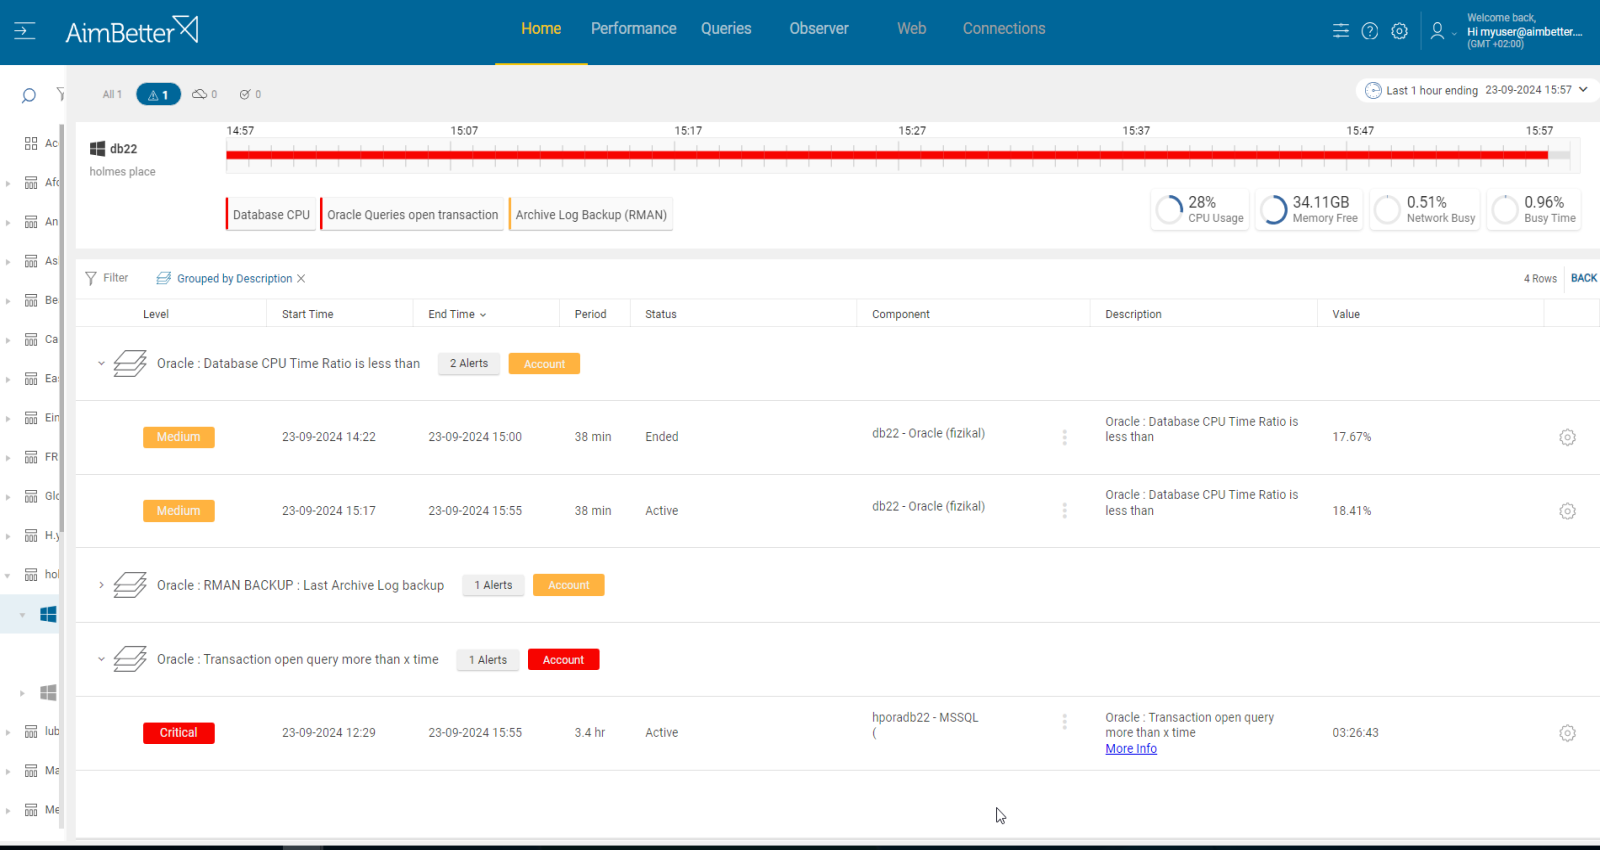
You will be immediately alerted if there is an issue with the disk utilization.
All data is available easily in one panel, without a need to work hard when trying to gather it.
Recommended action
Cancel unnecessary programs that cause high disk utilization. Consider changing the division of the activity to prevent server overload. If needed, optimize SQL queries by implementing new indexes to optimize input/output or reviewing the current query plan.
If needed, upgrade the hardware to spread I/O activity across multiple disks.
You can read more in the following article https://www.aimbetter.com/disk-response-times/
2- Network Latency. Priority: Medium
When the network is overutilized, time delay occurs as data is transmitted slowly between different systems.
For Oracle databases, network latency can impact the performance of several environments, such as application clusters, network areas, and client-server applications.
Usually, delays are felt in the client application and Oracle database interactions.
Sometimes, unusual levels of traffic may be coming from external operations.
Problem identification:
Users might complain about longer connection times to applications, applications will work slowly, and data might not be updated (for example, when replication is delayed).
You should use a network traffic monitoring tool to monitor your network traffic. This tool will allow you to identify abnormal network traffic and its source.
- First, you have to identify the overload. For Windows OS, use a network monitoring tool to check how much traffic flows through your network and which applications or devices use the most bandwidth. For Linux, you can check with the commands “top” for CPU and “nload” or “Netstat” for Network. Most tools help pinpoint when a problem starts, but you can’t compare to old time frames.
- Review your network logs to see if there are any unusual patterns or events that correspond to the spike in network traffic. This task might take hours of work. If the high traffic source is external, you should contact the external resource organization. See if they can lower the traffic amount.
- Look for queries that perform large table scans or joins or use a large amount of temporary storage. You can use OEM(Oracle Enterprise Manager) to monitor network performance metrics, including response times and connection speeds. Use Oracle’s AWR(Automatic Workload Repository), looking for wait events that are indicative of network-related delays, such as SQL*Net message to/from client, SQL*Net more data to/from the client, gc cr block send time, gc cr block receives time. This step may be complicated and take hours (or days) of work, and you can’t guarantee precise results when checking online statuses with no historical events.
- Look for a way to optimize the queries’ performance. This might involve adding missing indexes or changing query execution plans. This mission might be complicated, requiring a highly skilled DBA who can view a complete SQL query plan that is long and complicated.
You will receive an alert once there is a network latency parallel to the high database CPU ratio.
You will also be notified about database abnormal activities.
Recommended action
If the higher network traffic is because of external operations, contact its organization to check whether they can reduce the network traffic amount. Otherwise, manage your network traffic differently.
Use batch for SQL operations. Send commands in a single batch rather than making multiple smaller requests over the network. Once you do this, follow up to see whether the performance improves.
If needed, increase network bandwidth.
You can read more at https://www.aimbetter.com/network-latency/
3- Inefficient queries. Priority: Medium
Queries or updates that take longer than expected to execute can be caused by various reasons. If queries are not properly optimized with inefficient query execution plans, it can lead to poor performance, inefficient data access, and increased resource usage.
Execution plans provide valuable insights into how the queries are being processed and help identify areas of inefficiency.
Problem identification:
Identify which queries are running long and whether resource usage has increased. Check the indexing and query execution plan.
- Track the database server activity: Identify which statements have a high execution time and consume the most resources. For Oracle, you can use the built-in AWR together with SQL Trace, which can include data from top SQL statements, execution plans, wait events, and resource consumption. This mission requires a skilled DBA.
- Identify if the database CPU time ratio is affected by long running or inefficient queries and look for a change. You can use Oracle dynamic performance views like V$SYS_TIME_MODEL or use Oracle’s AWR reports.
- Investigate the query code and execution plan, looking for missing indexes or excess subqueries. To get this data, you can use Oracle tools like EXPLAIN PLAN for execution plan data or SQL Access Advisor and DBA_ADVISOR for missing index recommendations.
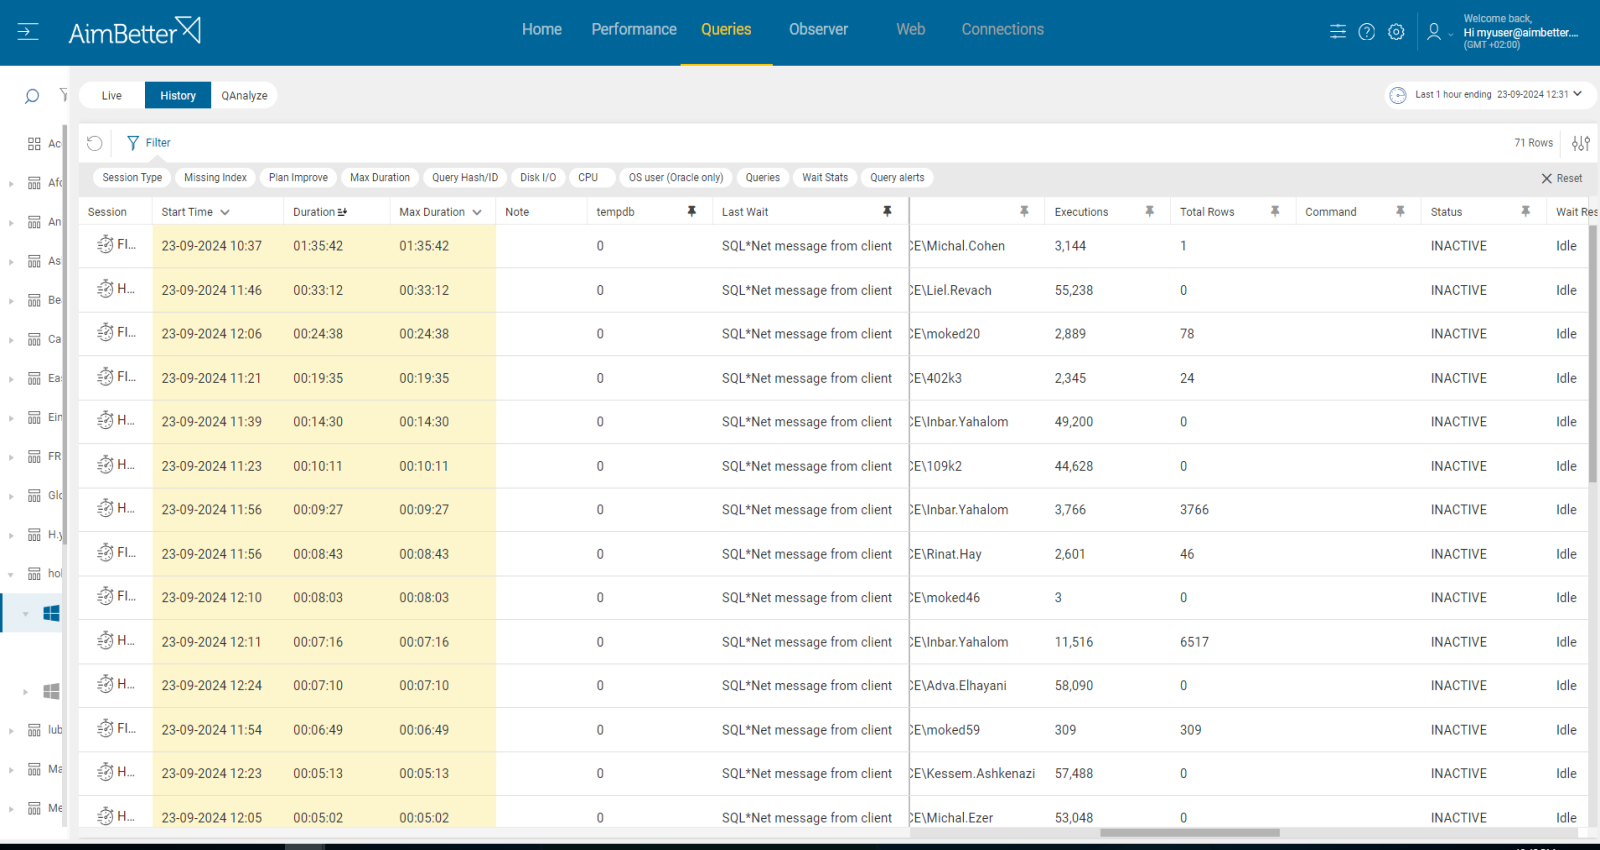
All running queries can be viewed from a single screen.
You can filter and sort the queries by execution time or resource utilization or even search for a specific query text.
The query execution plan and missing indexes are available immediately, even when the queries run live, including notes showing improvement recommendations.
Recommended action
Check the bottlenecks of the long-running queries and optimize accordingly. Before making these changes, consult with a DBA who understands the data model.
You can read more in the next article: https://www.aimbetter.com/oracle-long-query/
4- Blocking queries. Priority: Low
Blocking queries affect database CPU time because they can cause resource overload, which forces the Oracle database to spend more time managing these waits. In addition, other queries or transactions must wait or be blocked until the blocking query completes its execution.
Problem identification:
Users might complain about delays when running reports, that they are stuck and not giving any results. Identify which queries are running long and whether they block other processes or are blocked. In addition, look for a change in the database CPU time metric.
- Tracking tools, such as AWR(Automatic Workload Repository) or Oracle’s dynamic performance views, can be used to identify blocked queries currently and check the database CPU time state. This task might be complicated. You should search for data related to session ID, duration, wait type, and the code of the affected queries.
- You can drill down to see which sessions are blocked, what SQL is being executed, and how long the lock has been held.
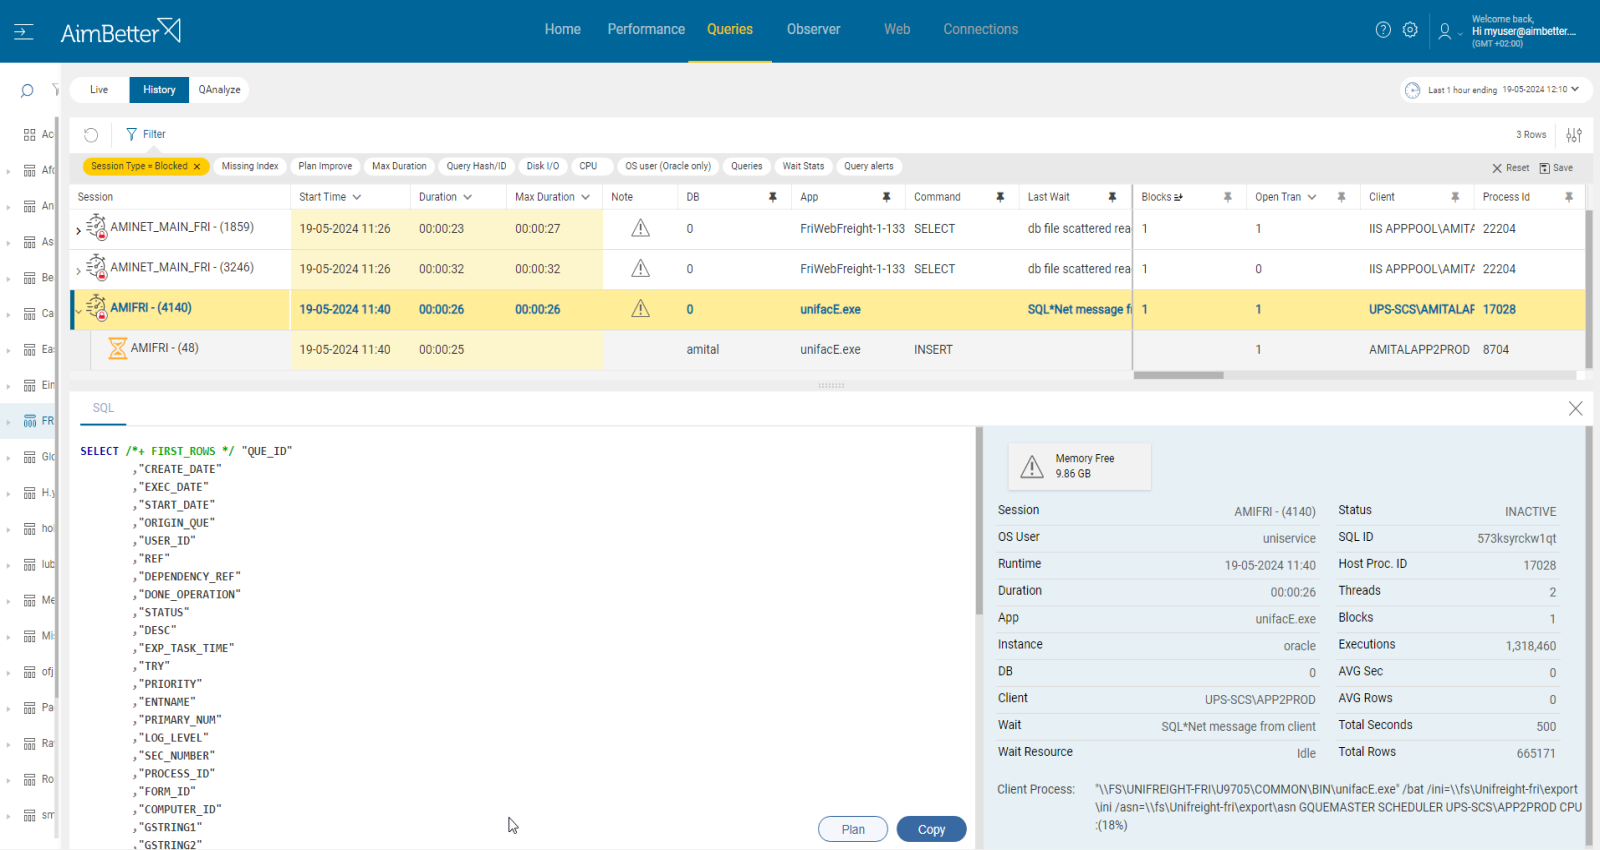
All layers of blocking queries are displayed in one panel, including all details.
You can examine blocking query events and database CPU time in parallel and enjoy multiple filters and sorting capabilities, such as order by block count, which facilitate quick visualization of what matters most.
Recommended action
Tune long-running queries for better performance and avoid DML operations that might cause the lock of entire tables.
You can read more in the next article: https://www.aimbetter.com/sql-block/


