SQL Server replication is the mechanism for copying and distributing data and database objects from one database to another and then synchronizing between databases to maintain consistency.
These are the key components involved in SQL Server replication:
1. Publisher
The Publisher is the database server that makes data available for replication. It can have one or more publications, which are collections of data (articles) to be replicated. Each publication contains one or more articles, which can be tables, views, or indexed views.
2. Distributor
The Distributor is a server that manages the distribution database and stores metadata and history data related to replication. It acts as an intermediary between the Publisher and the Subscribers and ensures that changes are propagated from the Publisher to the appropriate Subscribers.
The Distribution Database contains the replication status data, replication history, and transactions awaiting distribution to the Subscribers.
3. Log Reader Agent
The Log Reader Agent is a background process that monitors the transaction log of the Publisher’s database. It reads the log and copies the transactions marked for replication to the distribution database. This step is crucial in transactional replication.
4. Subscriber
A Subscriber is a database server that receives replicated data from the Publisher. Subscribers can receive data through various replication types:
- Snapshot Replication: The entire data set is copied at once from the Publisher to the Subscriber.
- Transactional Replication: Only the incremental changes are replicated from the Publisher to the Subscriber.
- Merge Replication: Changes can be made by both the Publisher and the Subscriber, and they are merged together.
Understanding these components and their interactions is crucial for setting up and managing SQL Server replication effectively.
Symptoms
Users may report problems that indicate replication issues. For example, they might report seeing old data, missing records, or inconsistent data in reports or application screens.
Impact: Critical
Replication problems can lead to data inconsistencies, application errors, performance issues, and potential business disruptions due to outdated or missing information in the replicated databases.
Expected behavior
Database replications should be reliable and any latency that can cause data inconsistency should be investigated.
Find out how you can save hours of work when investigating the root cause of this issue.
Possible causes
1- Database corruption. Priority: Critical
Database corruption refers to errors within the database files or structures that prevent the database replication system from accessing or manipulating data properly. Corruption can occur at various levels within the database, such as the database itself, indexes, tables, or data pages. A corrupted database might make it unavailable for running queries.
As a result, running queries with the corrupted database will cause failure, slowness, or time-outs. Transactions may be automatically rolled back. In severe cases of corruption, data loss may occur.
SQL Server may report that a table in the database cannot be accessed because it has become corrupted.
Problem identification:
Users might complain about immediate errors when trying to run processes. Several error messages of corrupted tables may be displayed during an operation.
- Use tracking tools such as SQL Server profiler or extended events to collect information about exceptions. Make sure to put appropriate filters to track the exact exception that needs to be investigated. You should look for query time-outs or table-corrupted categories. This task might take time, won’t be provided with historical data, and should be done by a professional DBA.
- Check error logs and event logs for indications of database corruption and replication-related error messages and warnings.
- Use built-in tools like DBCC CHECKDB (for MS SQL Server) to perform consistent database integrity checks on the database.
- Using all checks that were done, examine the error messages and try to see if there are standard details such as host, database, and query involved to ensure you are tracking the same issue.
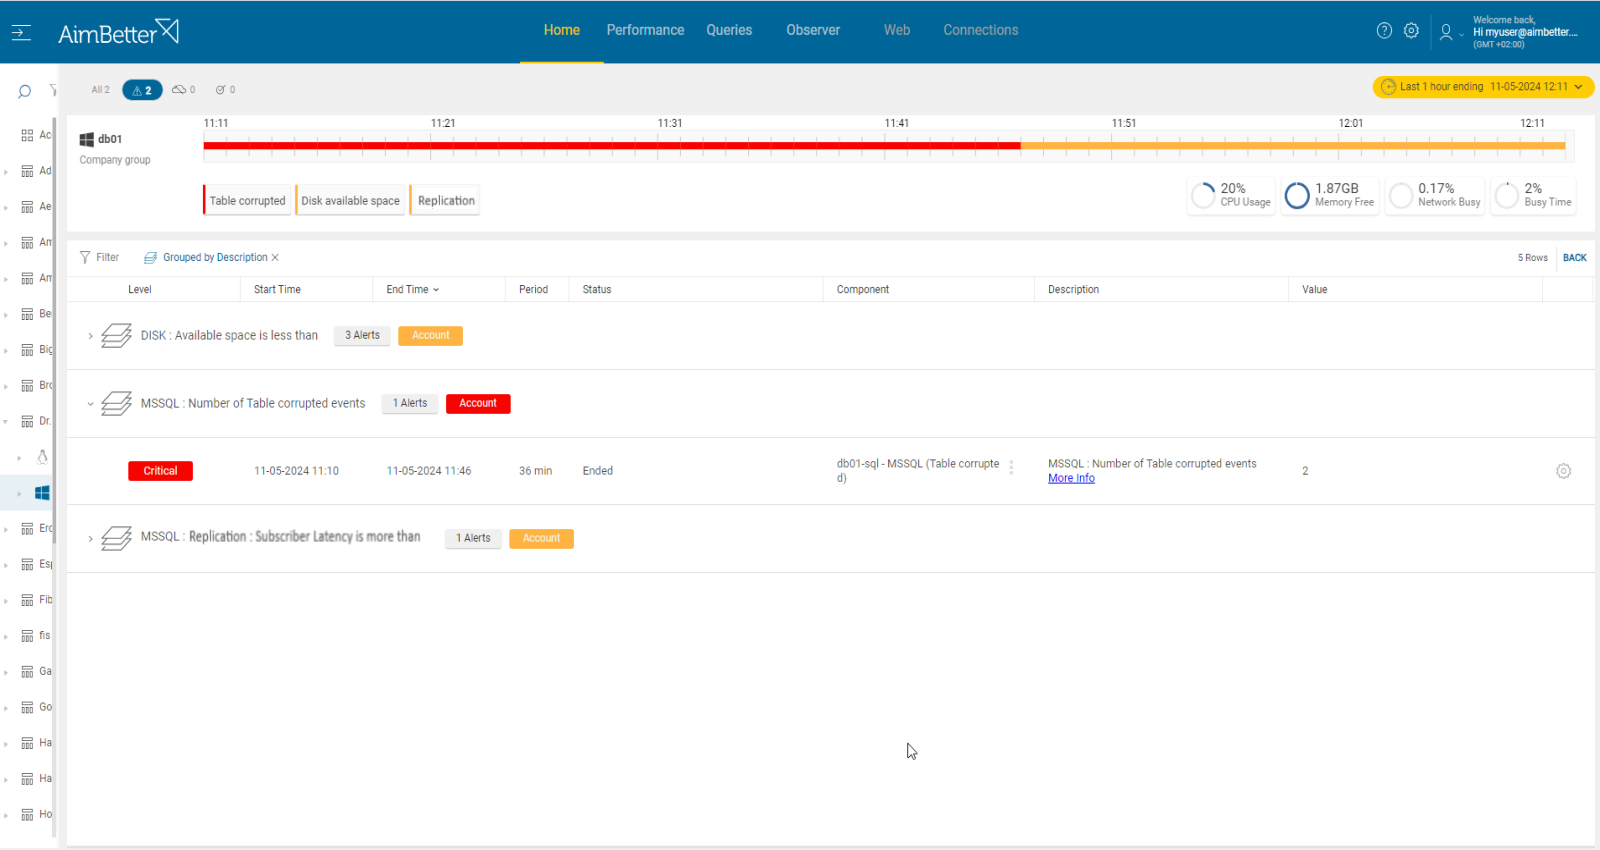
Aimbetter will notify you about any latency in the database replication system and the specific component involved: Subscriber, Distributor, or Log Reader.
Along with this alert, if there is data corruption, you can easily check its exact location and other useful information to take immediate action.
AimBetter also simplifies the control of DBCC checks, if they are constantly made, and when.
Recommended action :
If possible, use utilities that allow you to repair corrupted data pages or structures. If unsuccessful, restore the database from the most recent backup file taken before the corruption occurred. This ensures that data integrity is restored to a known good state, yet there is a chance for data loss.
Before then, you can rebuild and examine indexes.
If the backup chosen to restore wasn’t close enough to date, implement other backup mechanisms that run more frequently for important production databases. A skilled DBA should do this.
2-Overloaded or inefficient hardware resources. Priority: Medium
Overloaded server resources such as CPU, memory, disk I/O, or network can slow down the MSSQL replication mechanism. It might happen due to a specific application or many processes running simultaneously.
Problem identification:
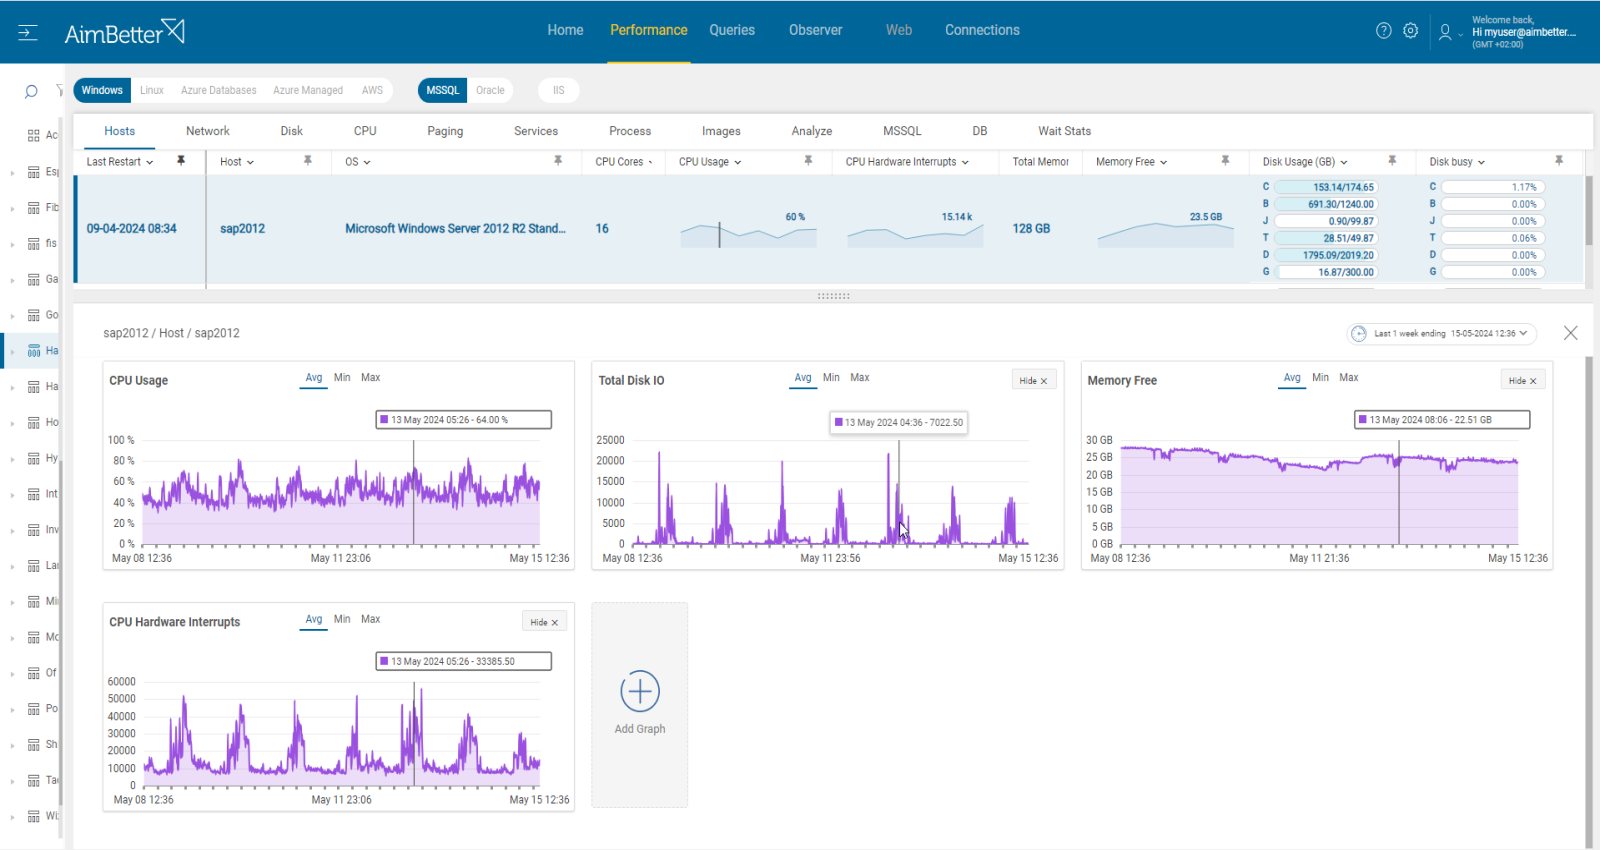
Check if CPU, memory, disk I/O, or network resources are highly utilized. Identify the source of the load and whether it is recurrent. Check if it happens when there is high latency in the replication mechanism.
- Check the Task Manager in order to identify the overload of hardware resources. For Linux, you can check with the commands “top” for CPU, “free” for Memory, “iostat” for Disk I/O, “vmstat” for Virtual Memory statistics, and “nload” Network.
- Use OS tracking tools such as Performance Monitor (for Windows OS ),or Performance Co-Pilot(For Linux) to identify which processes use hardware resources. For network activity, use a network monitoring tool to check how much traffic flows through your network and which applications or devices use the most bandwidth. Take into account that most tools help pinpoint when a problem starts, which you can’t compare to previous time frames.
- Check error logs and event logs for indications of database corruption and replication-related error messages and warnings.
AimBetter notifies if there is a high latency in the replication system simultaneously to increase CPU, memory, disk I/O, or network utilization. When all data is available in one panel, there is no need to work hard for investigation.
Recommended action :
Cancel unnecessary programs that cause high hardware utilization and schedule non-urgent processes at times of lower user demand.
Consider upgrading hardware if possible. Ensure proper network connectivity,
Monitoring would be useful for following up on this issue.


